

Approximately 5 minutes read
November 2020- January 2022
Project overview and goal
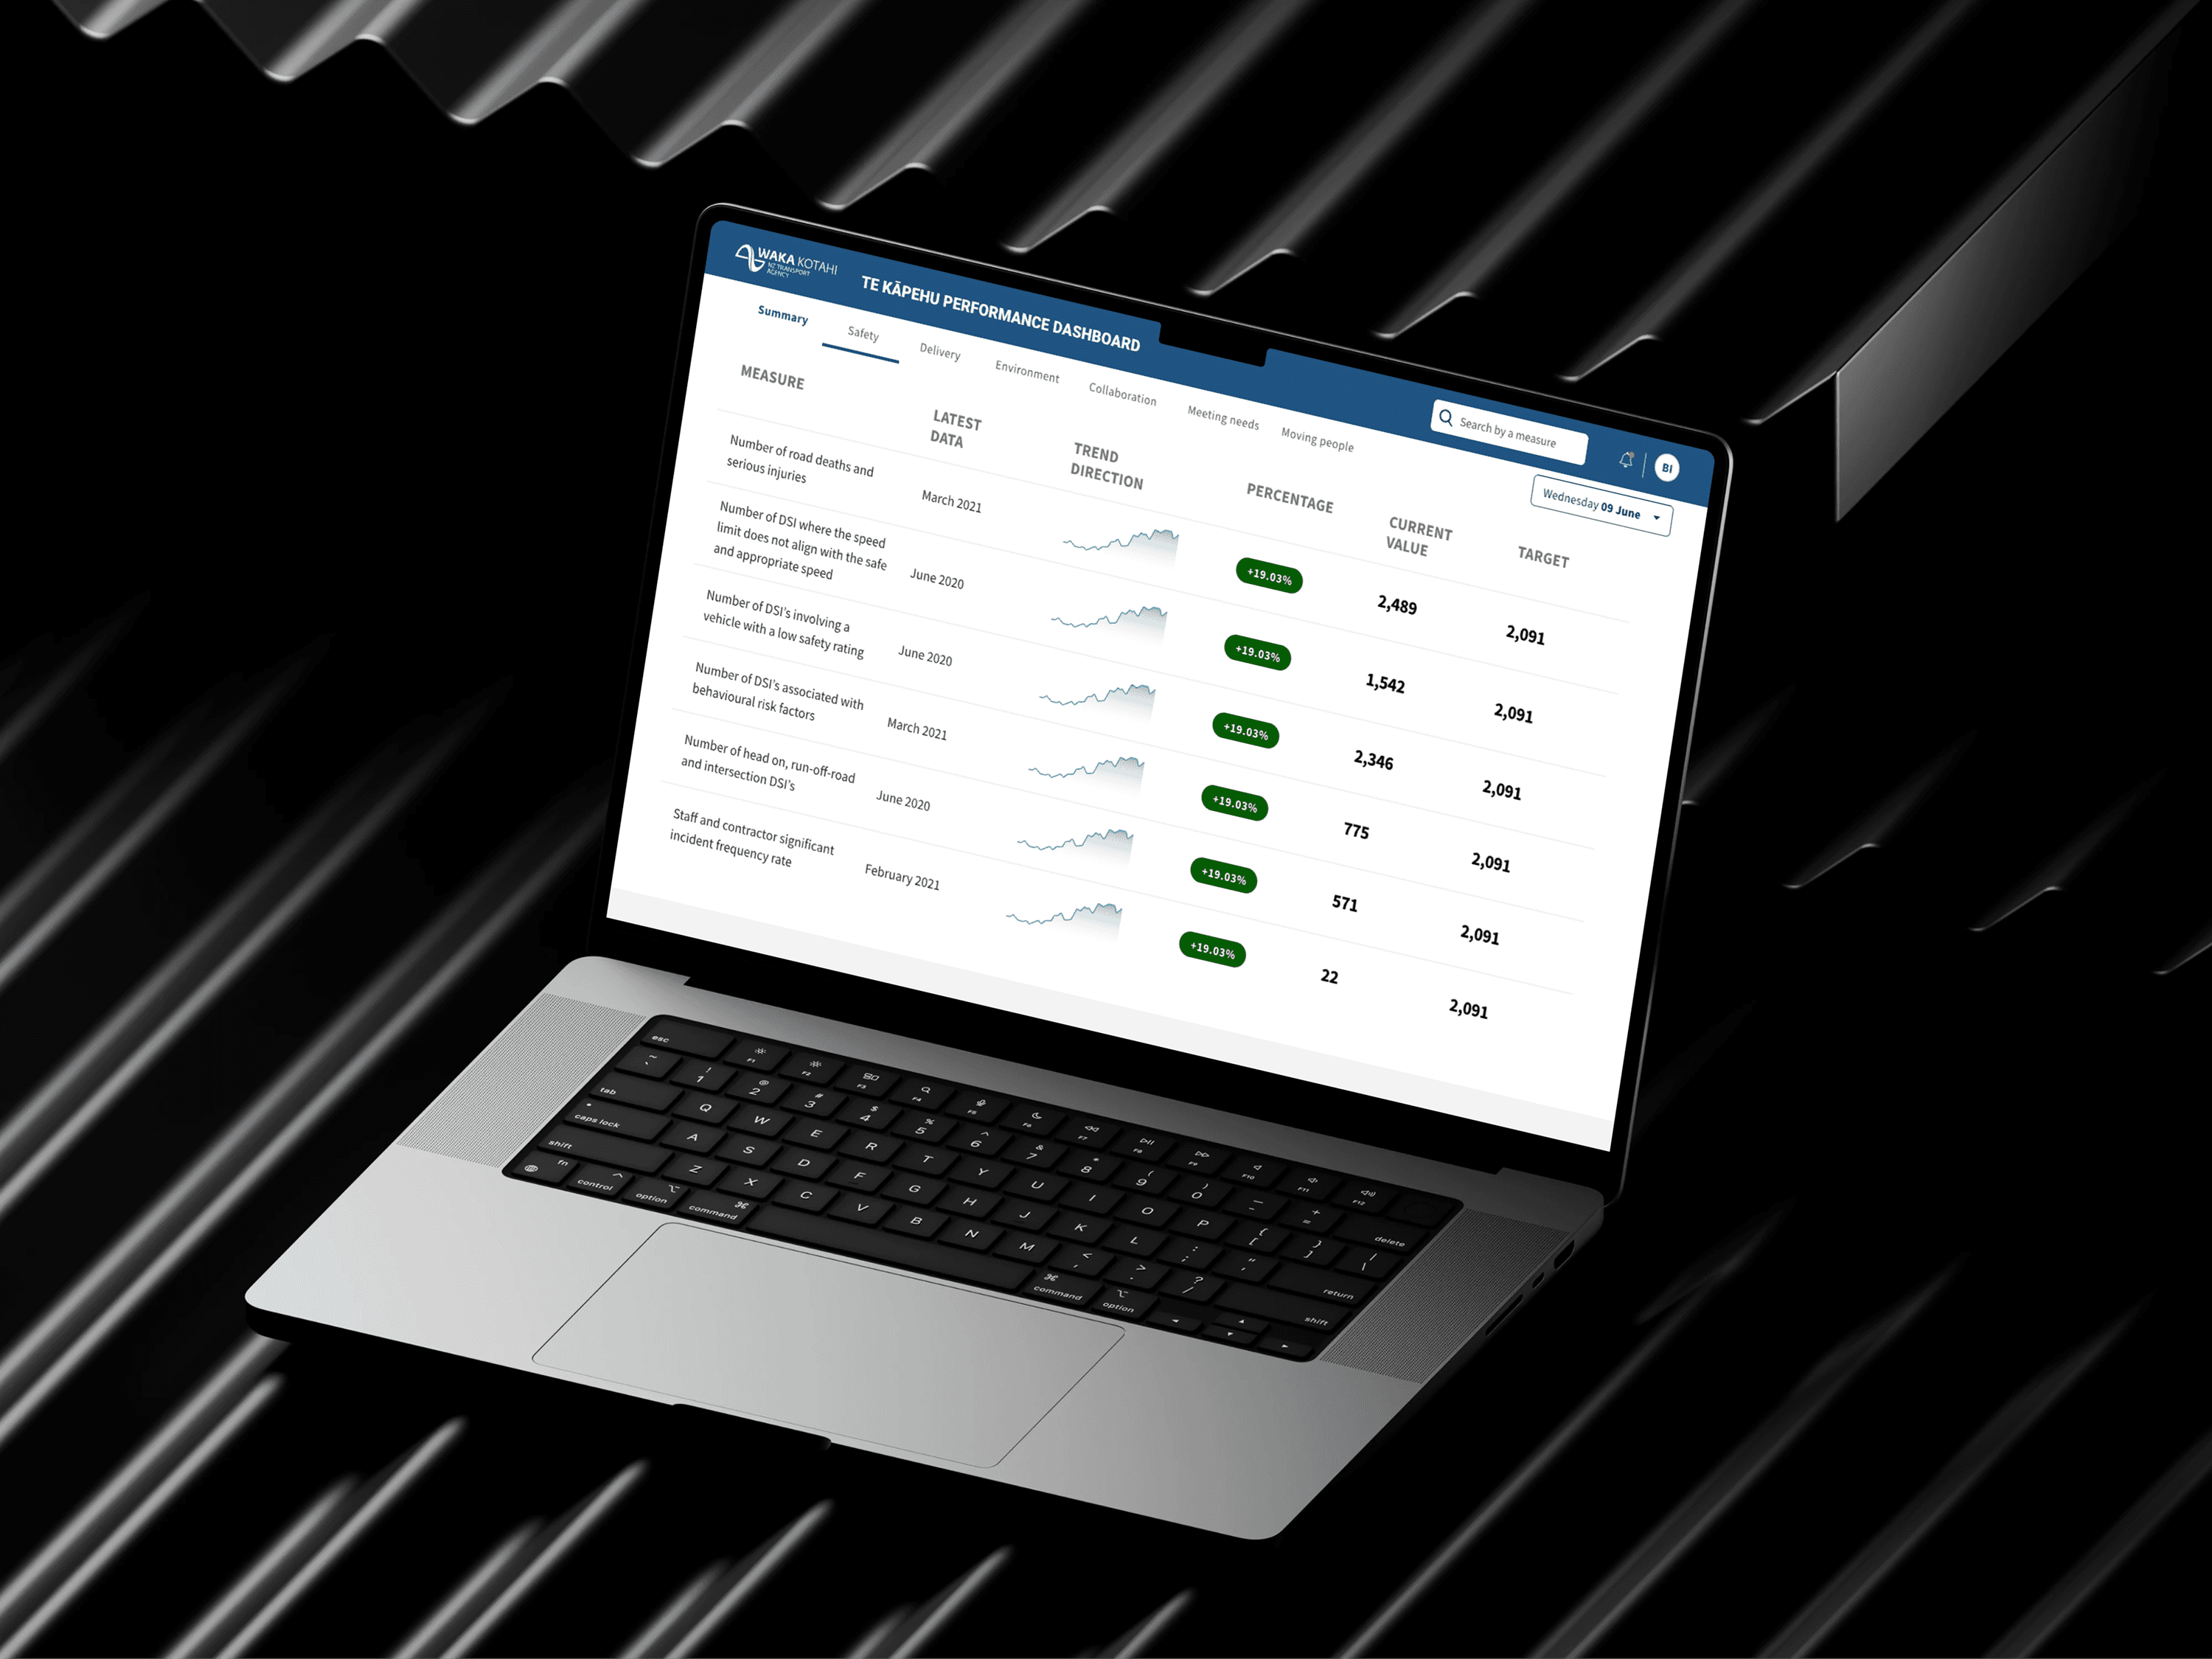
The purpose of this project was to Design and Deliver simple interface for a internal SAAS product NIEMS (National Incident and Event Management System) that could analyse complex data for traffic incidents, yearly contractor performance, regional roadworks and break it down into segments that can be easier for users to comprehend and make informed decisions.
My role and the wider team
I worked as the senior UX/UI in the project team alongside with the PM, Senior BA, Front end dev, backend dev and the end users (TOC operators)
Impact
The project impact was national wide level as all the TOC operators from Auckland, Wellington and Christchurch region were the end users
About the Organisation
Build, monitor and manage State Highway Network
Invest in land transport activities (CCTV cameras, build softwares, signages etc.)
Work with local regional authorities such as (Auckland, Wellington, Christchurch etc.)
Other activities like providing driver and vehicle licensing etc.
Organisation big vision
Road to Zero sets an initial target to reduce deaths and serious injuries on New Zealand’s roads, streets, cycleways and footpaths by 40 percent over the next 10 years. Reaching that target would mean reducing annual road deaths to 227 and serious injuries to 1,680 by 2030.
Design Process
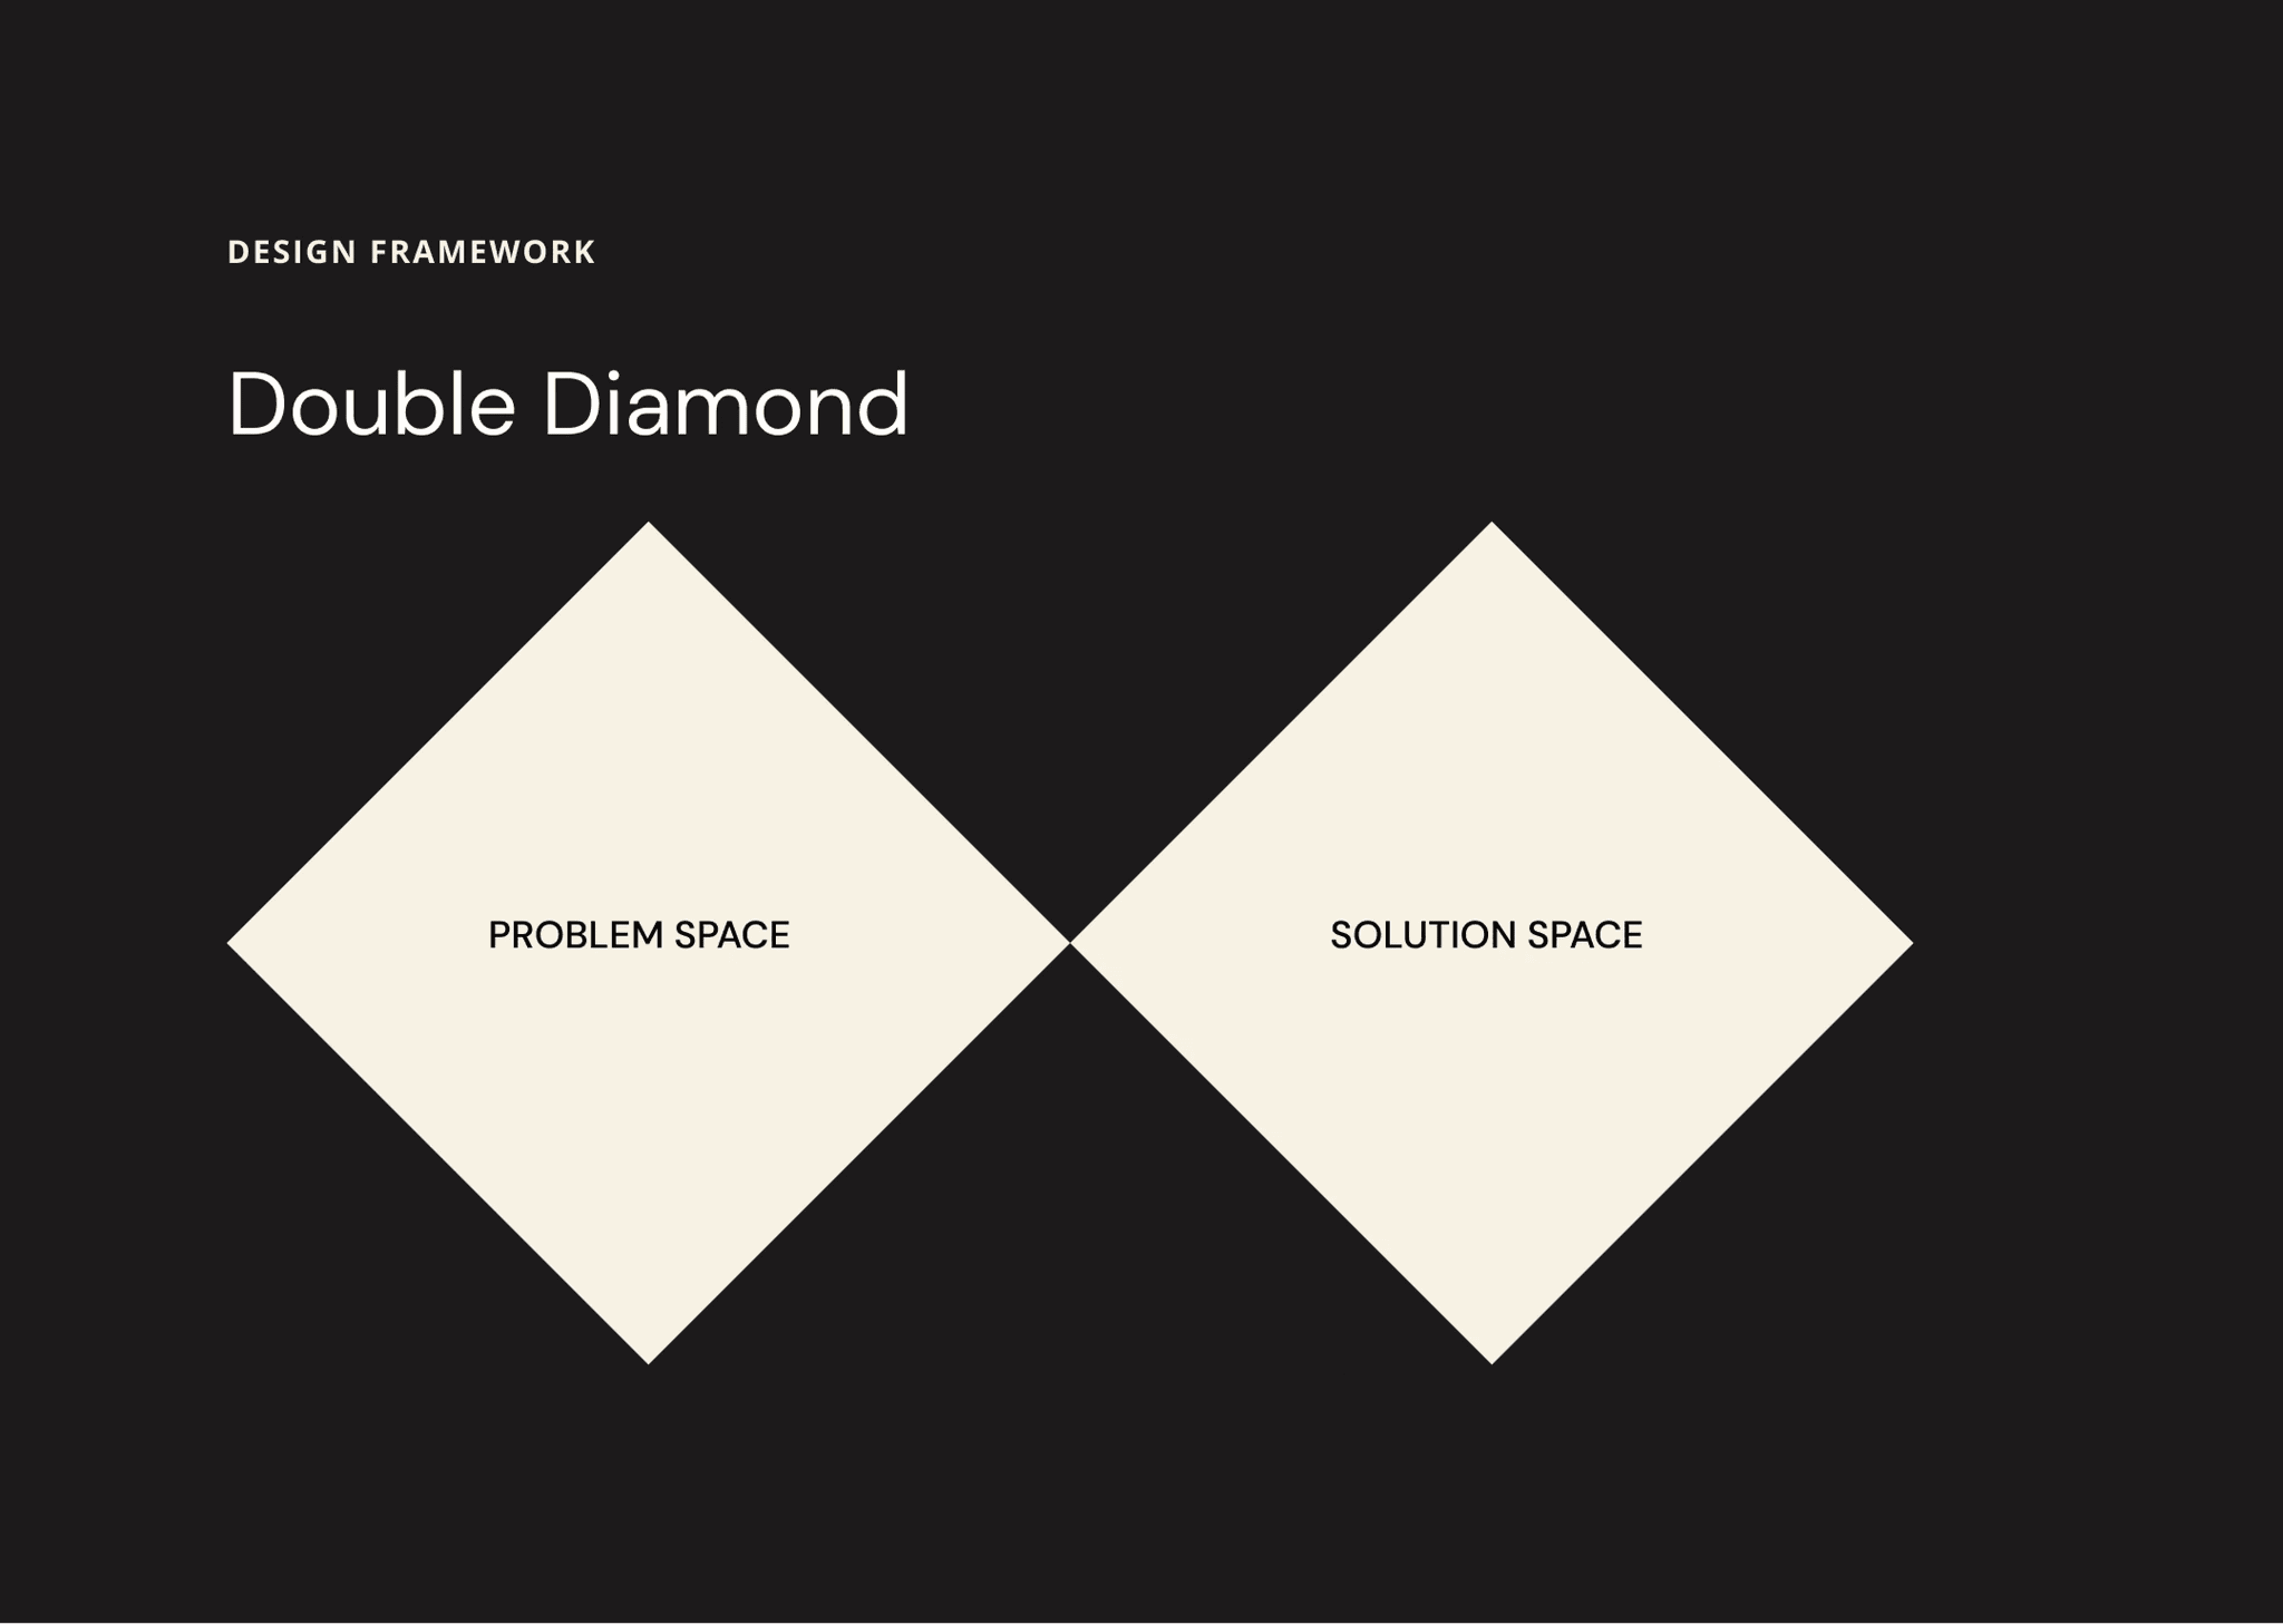
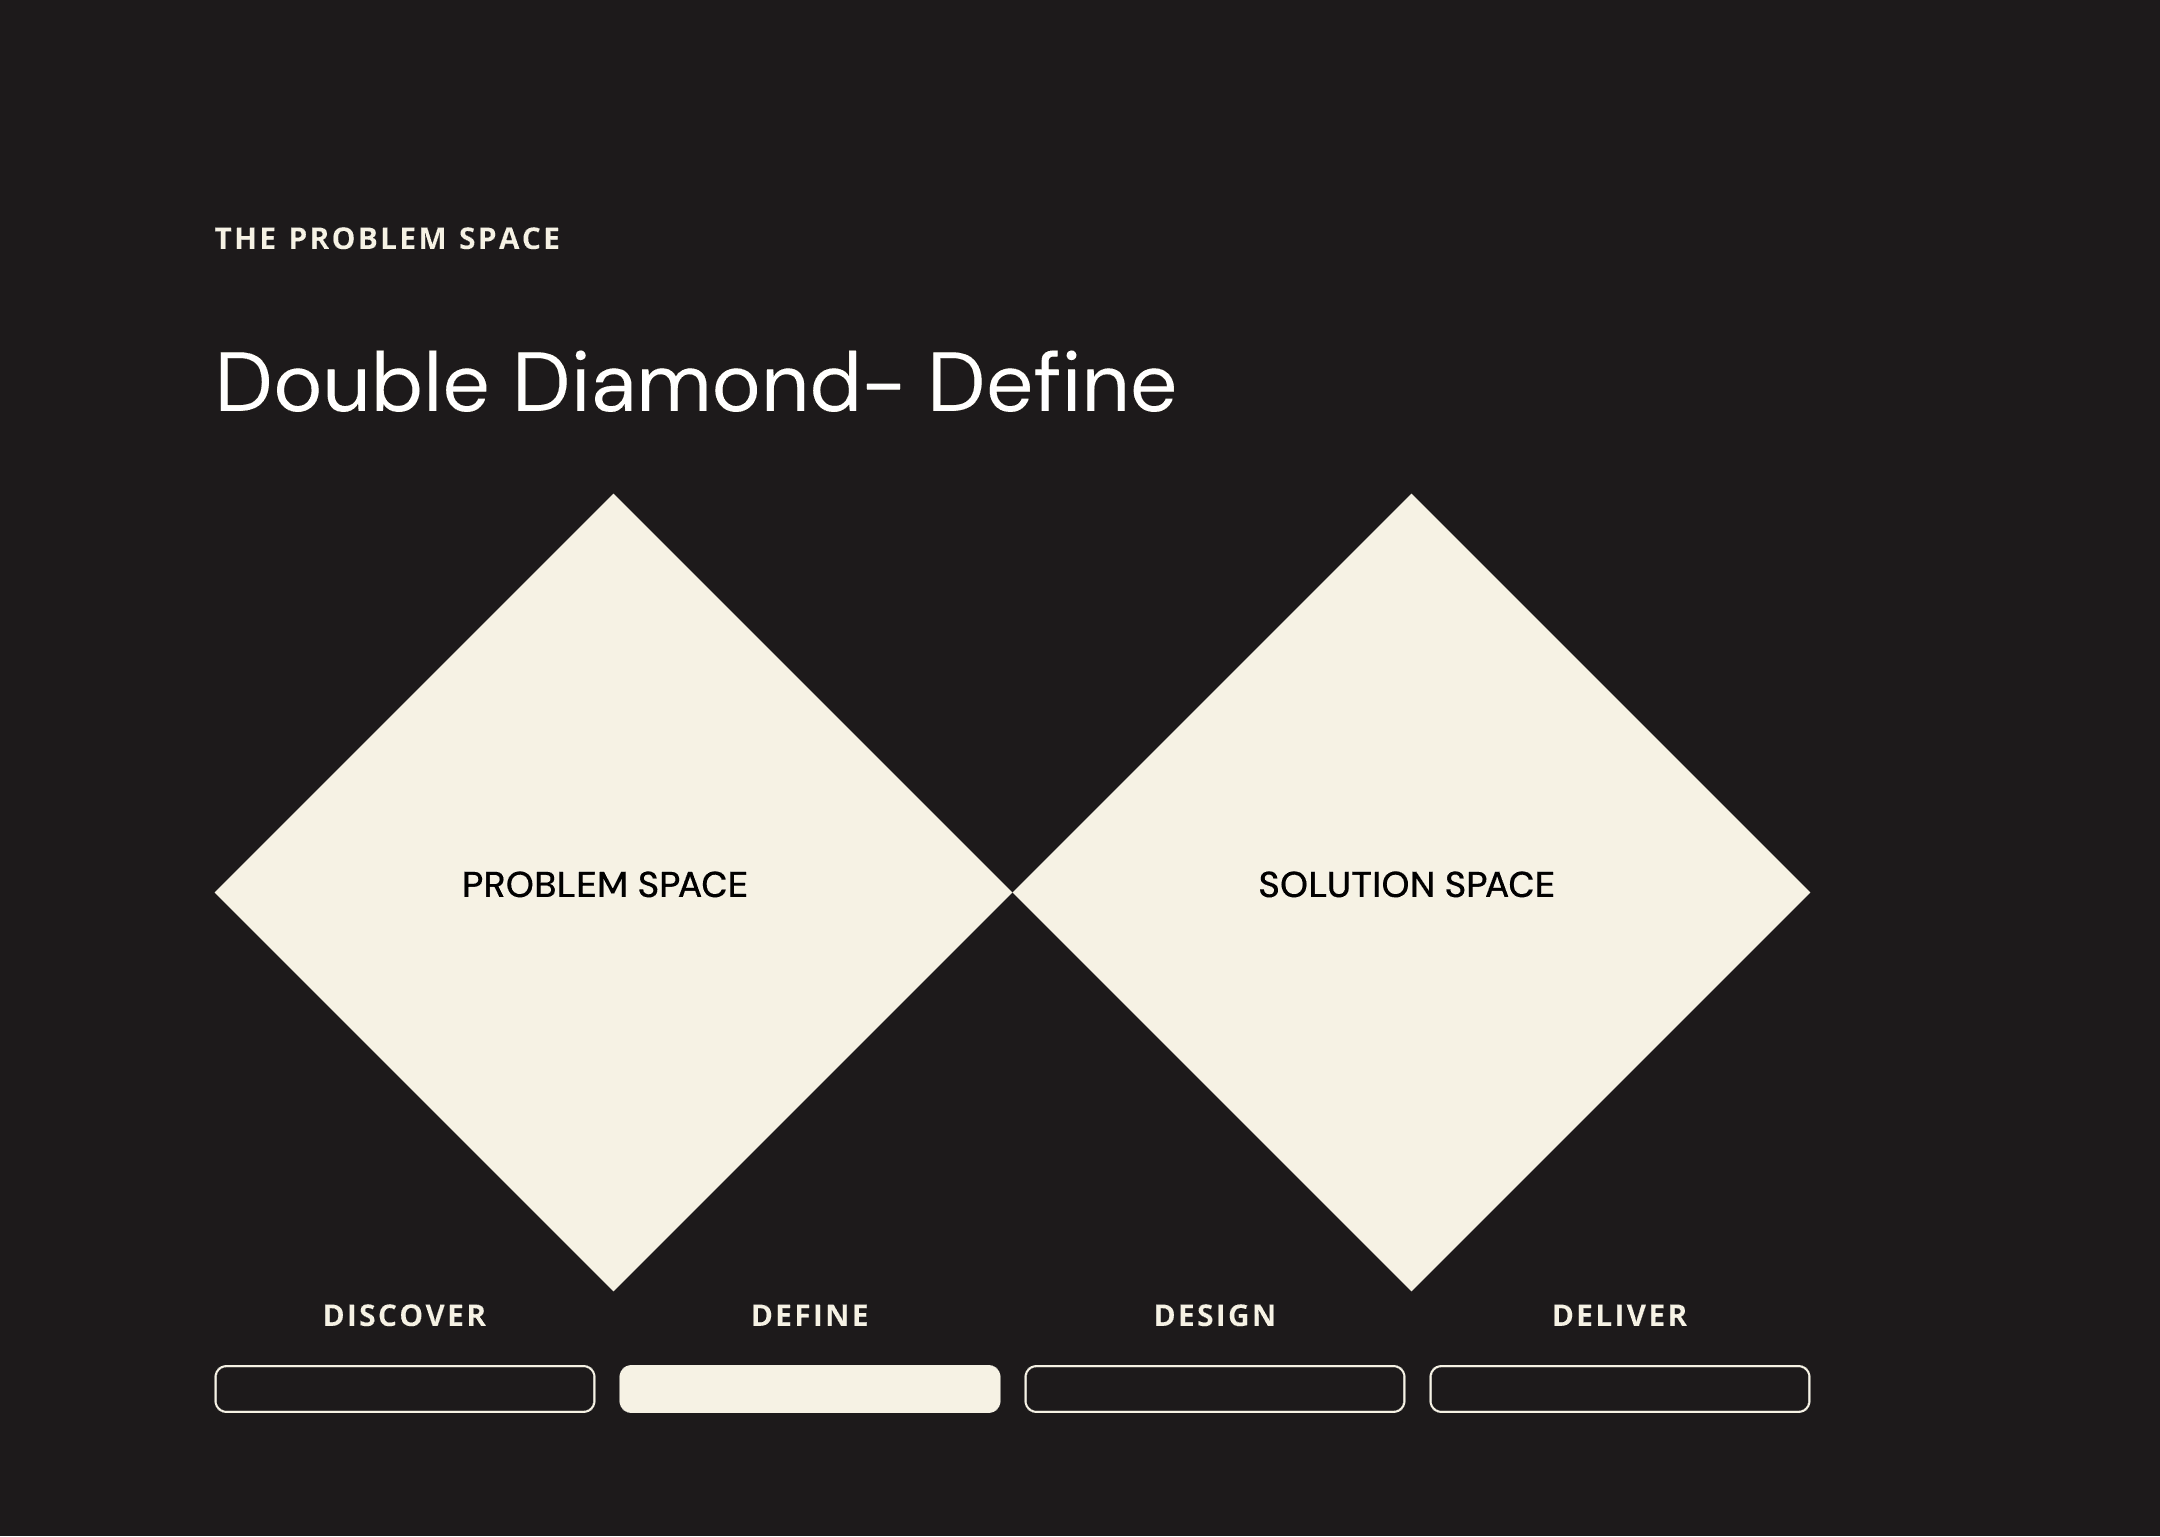
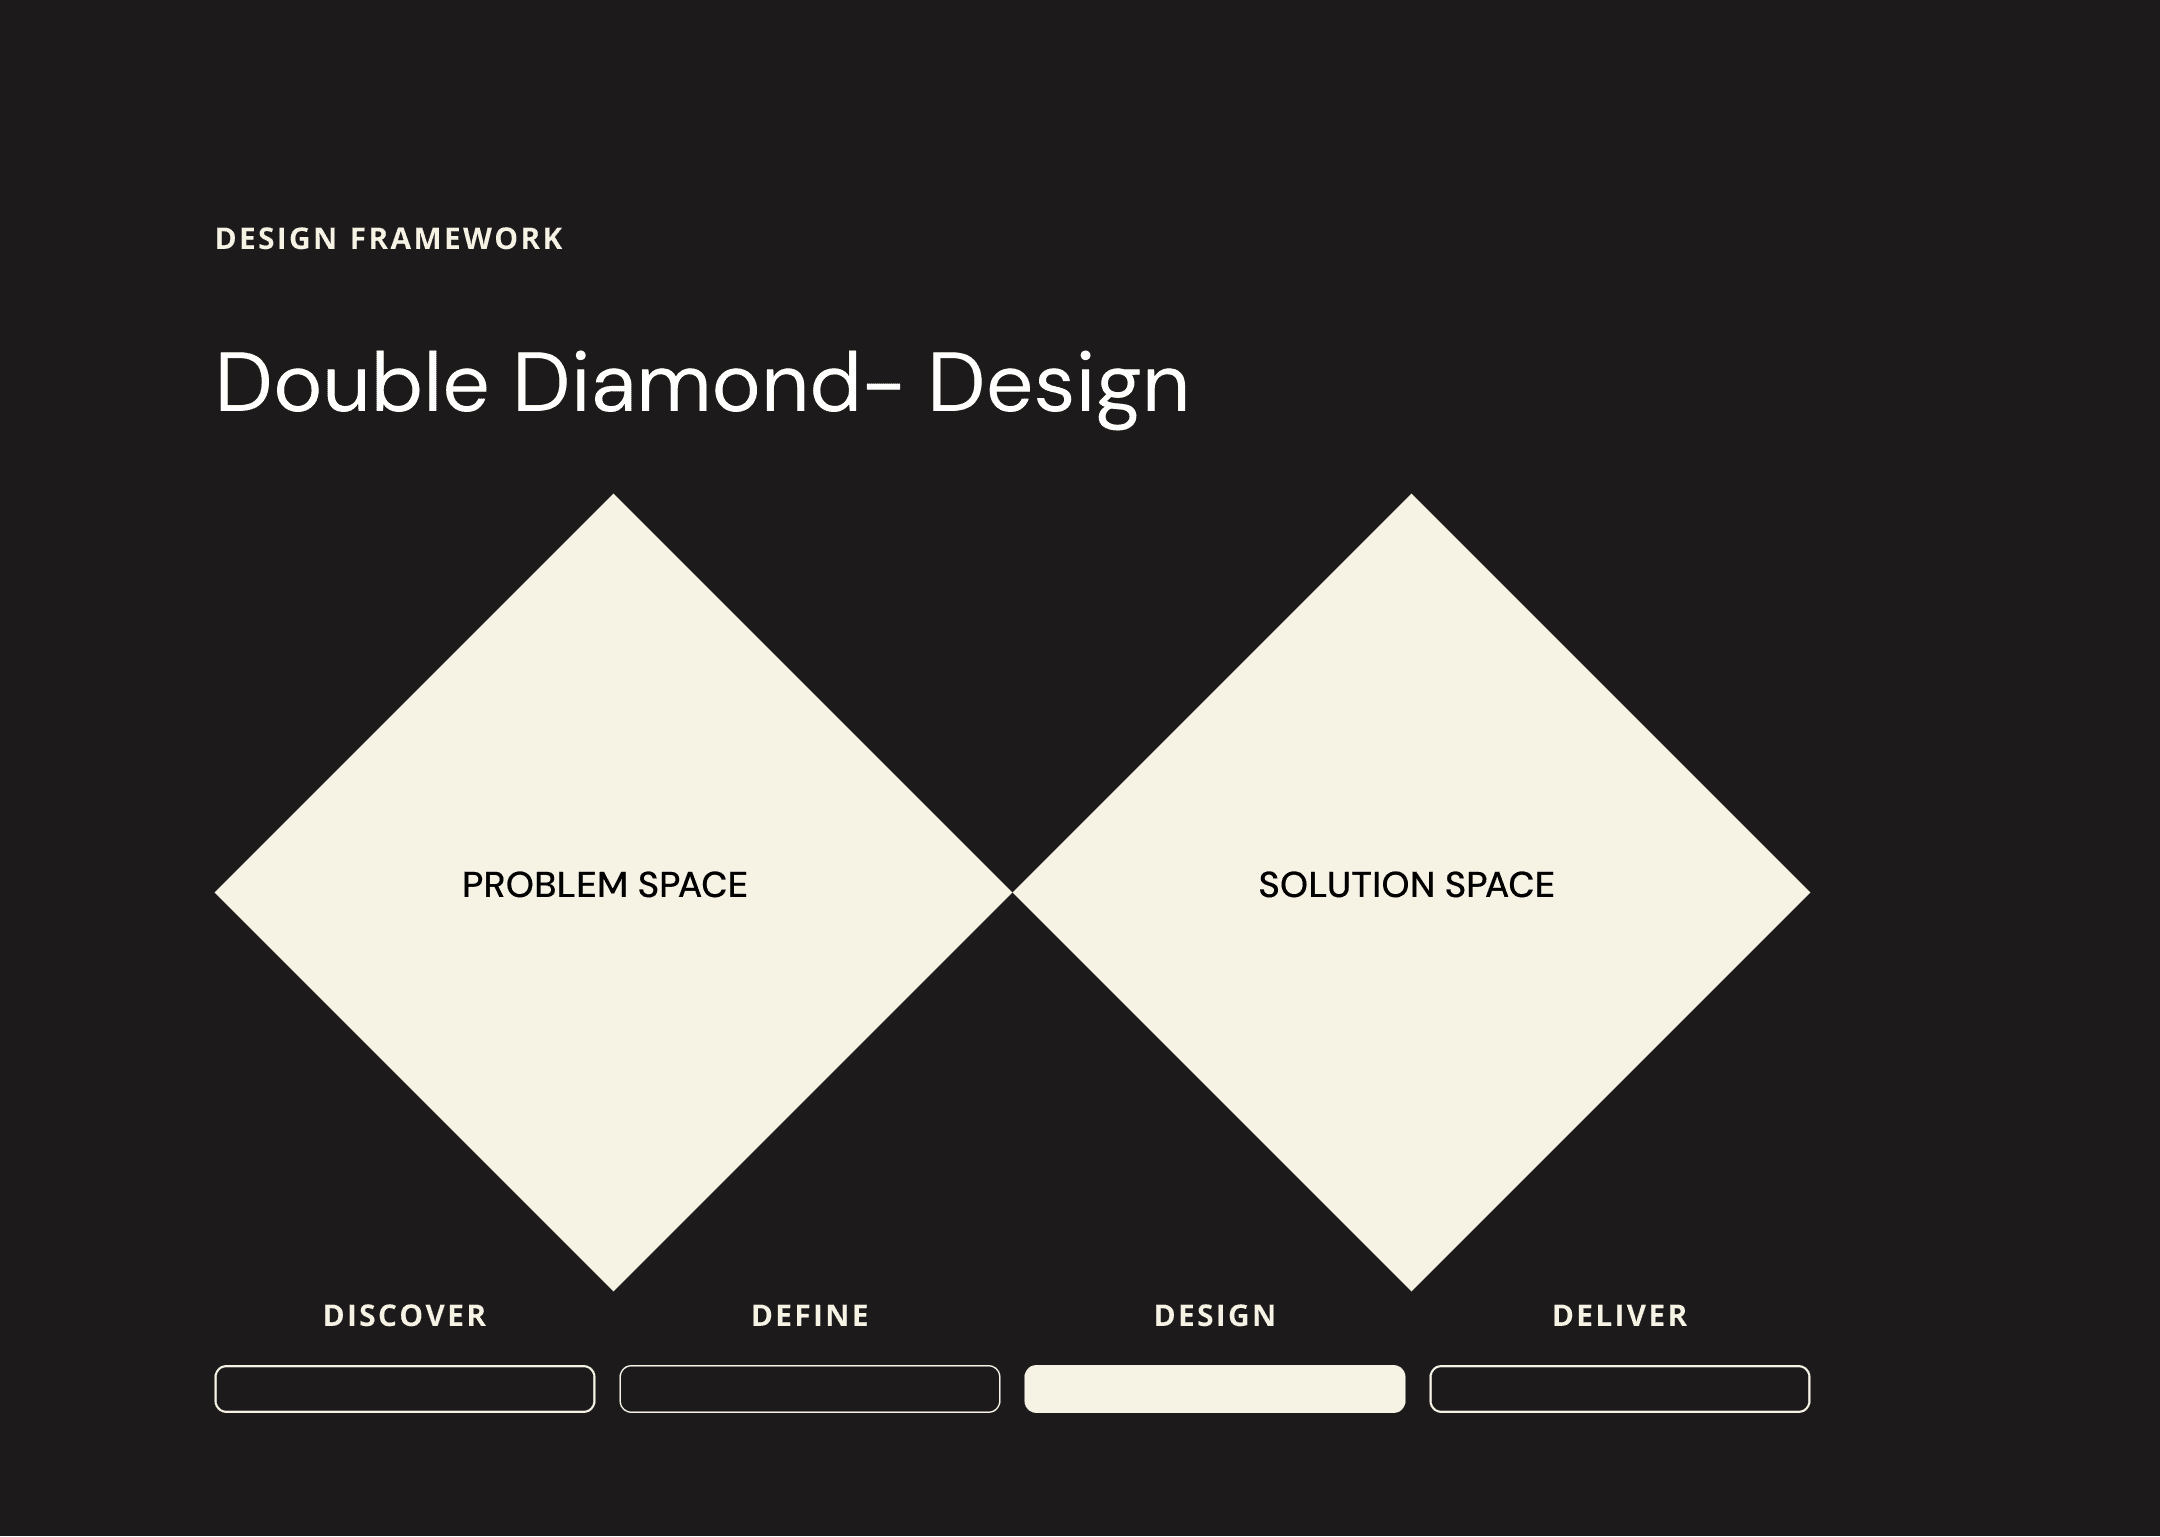
The agency adopted the agile working model to achieve our project goal. We followed the double diamond framework Discover, Define, Design and Deliver
Discovery phase
Qualitative research
A series of interviews and focused group sessions were conducted with the users to gain the requirements for the project. After a series of talk we were able to extract the requirements and have them documented on the confluence.

Discovery Phase
Understanding the users
1:1 Interviews
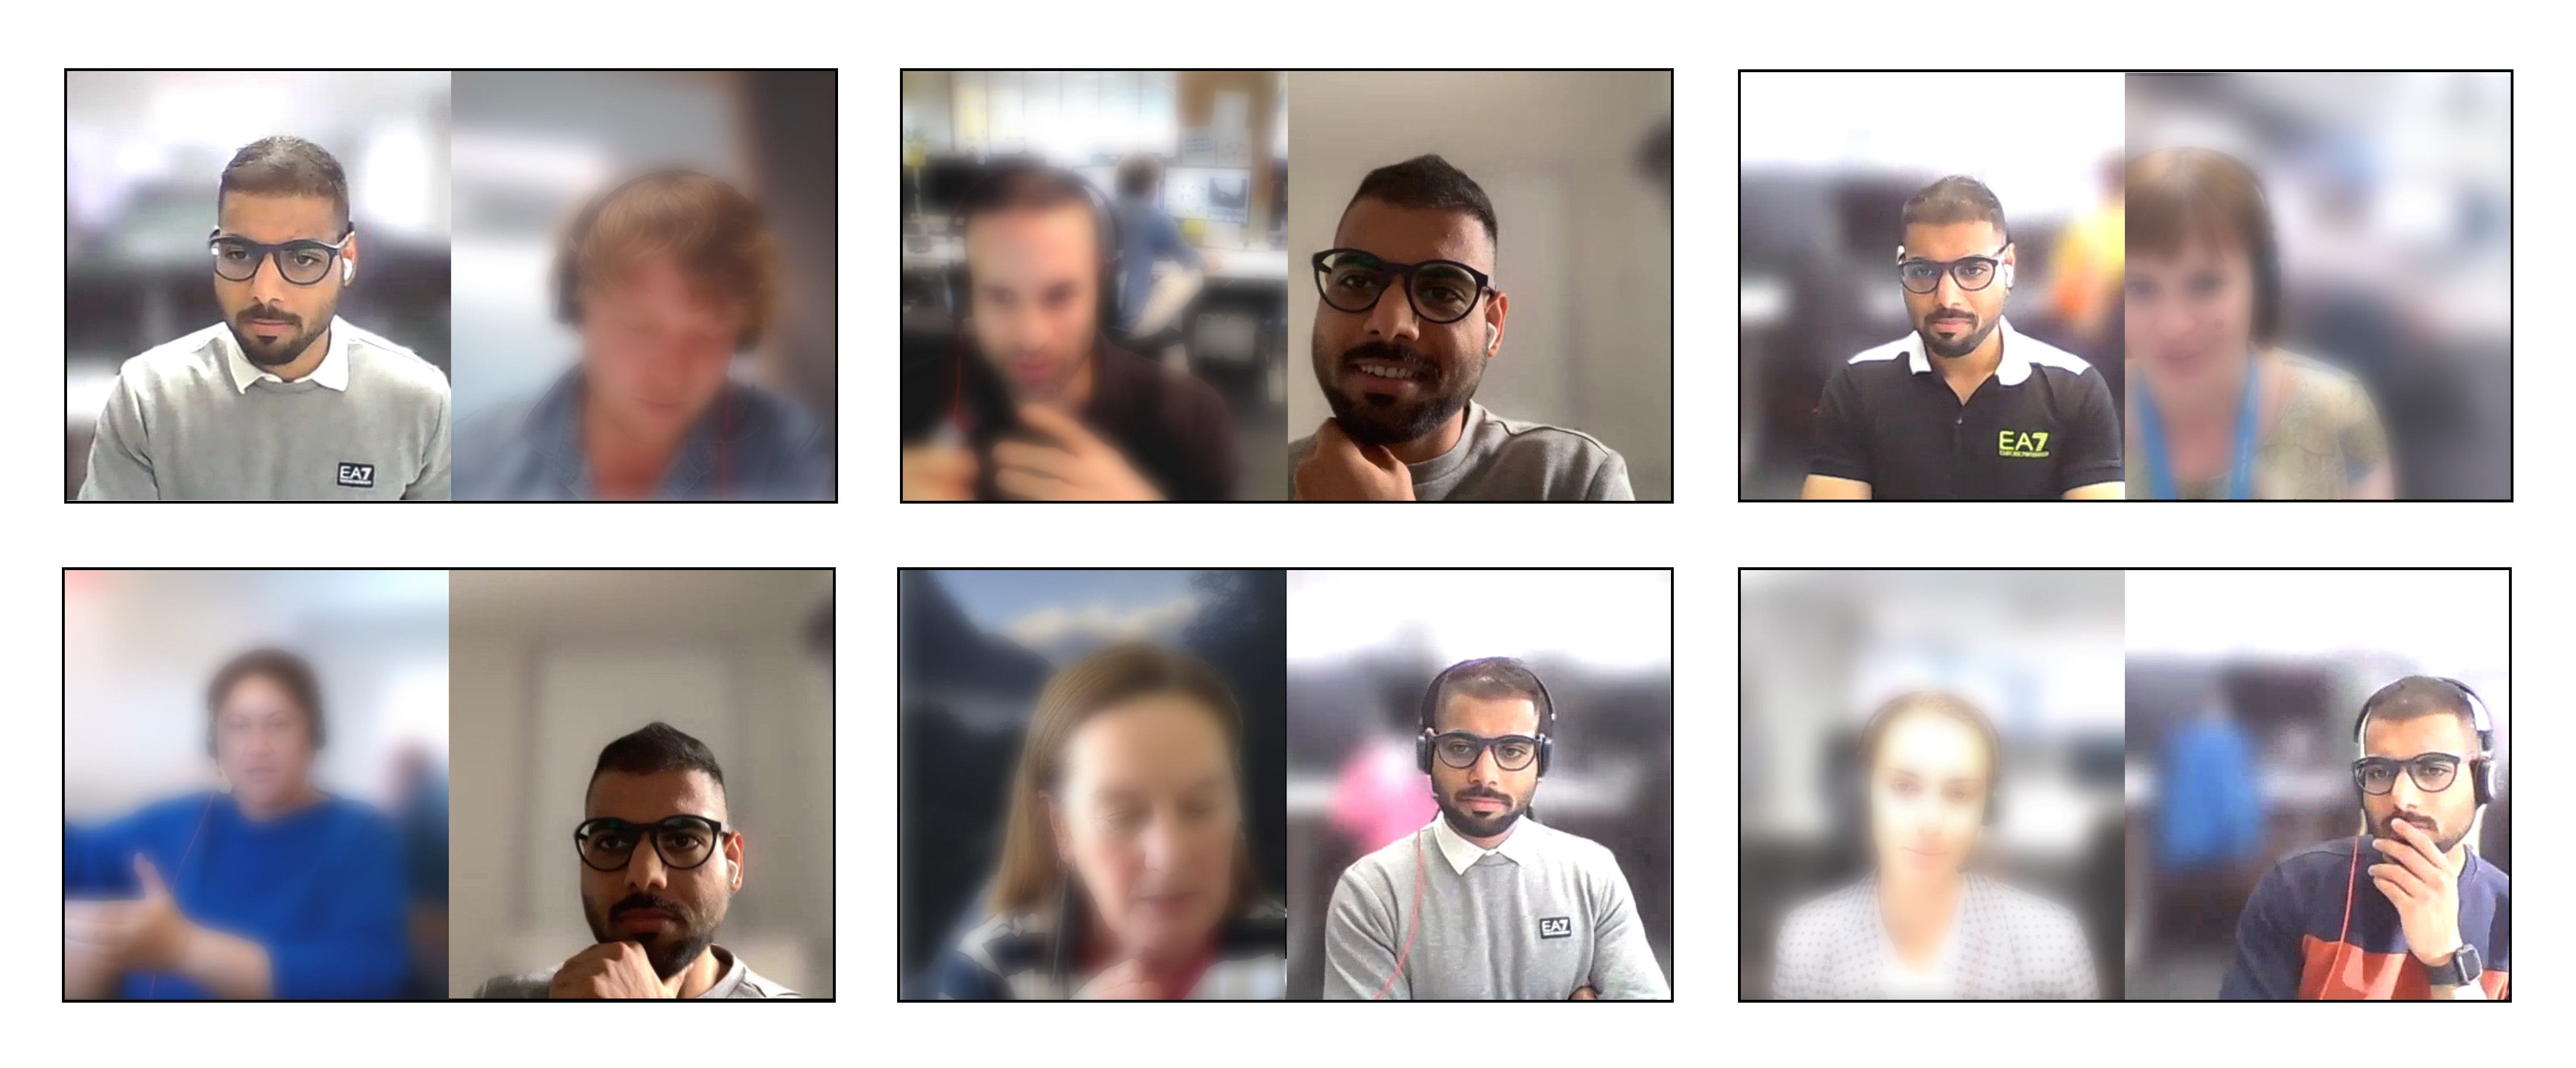
1:1 with ATOC, CTOC, WTOC users
Conducted field study
As a part of the user research process, I spent a whole working day at the Auckland Transport Operations Centre (ATOC) to understand and observe users and studied their ways of working in natural environment
Few of observations and learnings;
The end users were technical people
The users were exposed to multiple screens
They worked in 12 hours shift
The TOC is functional 24x7
They monitor over 450 CCTV cameras

Quantitative research
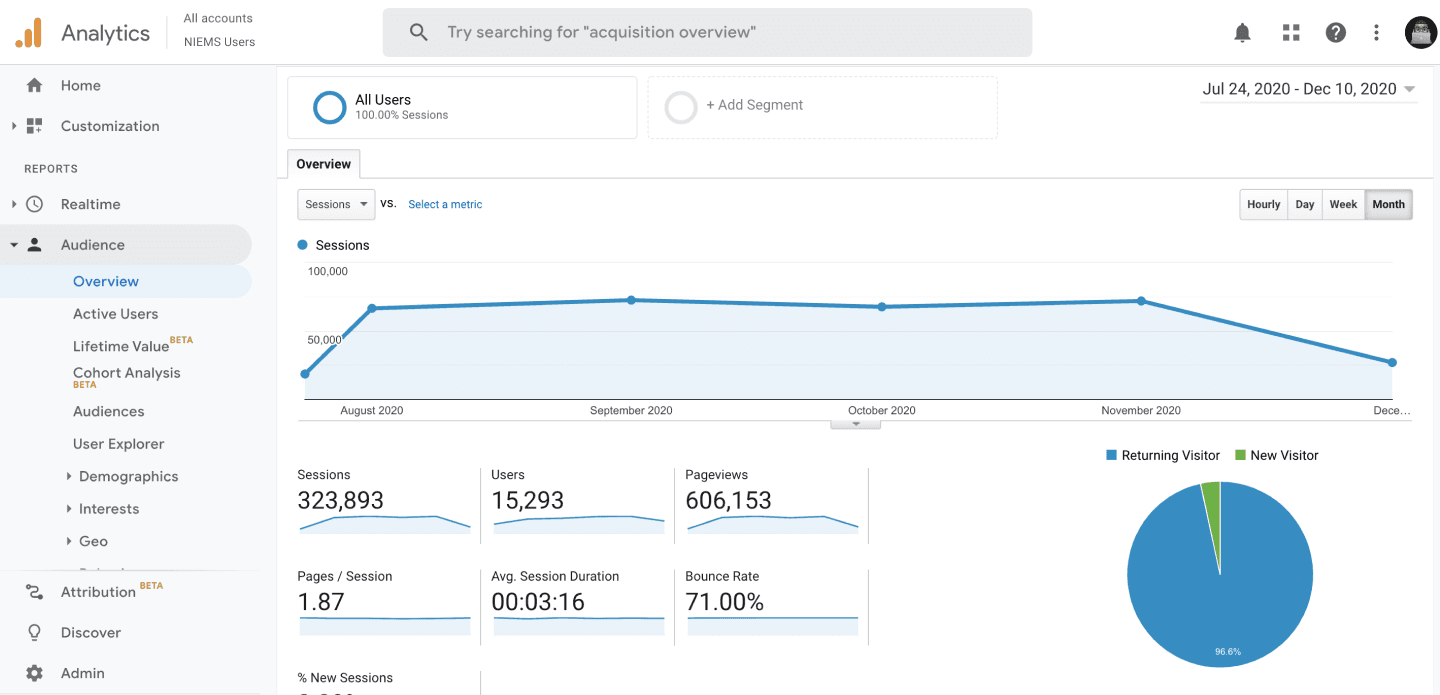
Google analytics
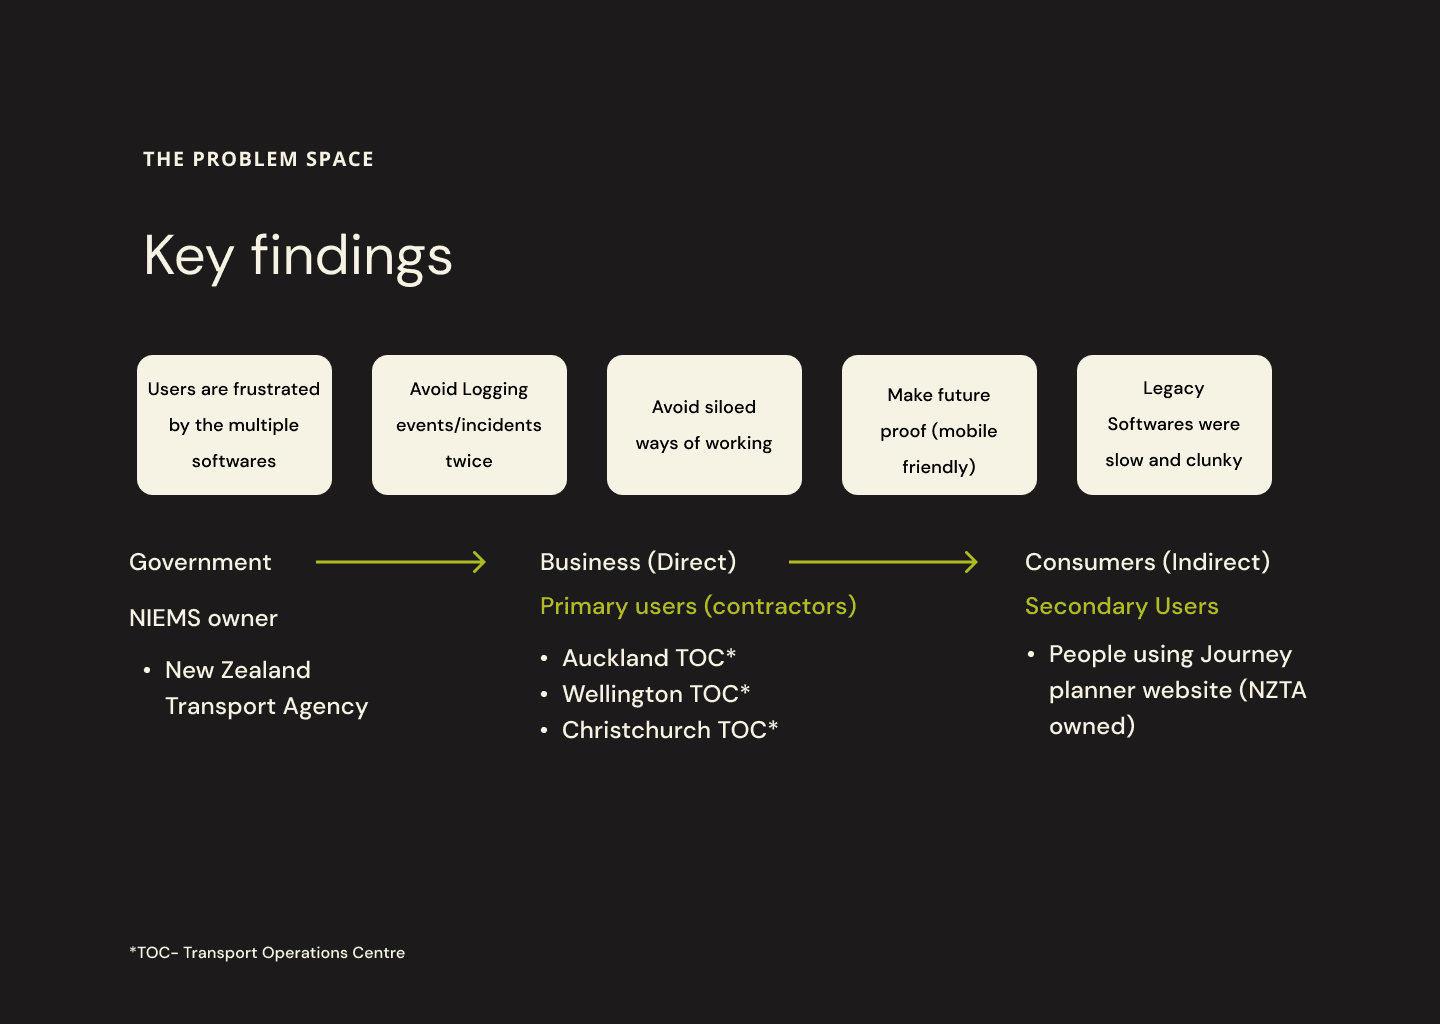
Problem space
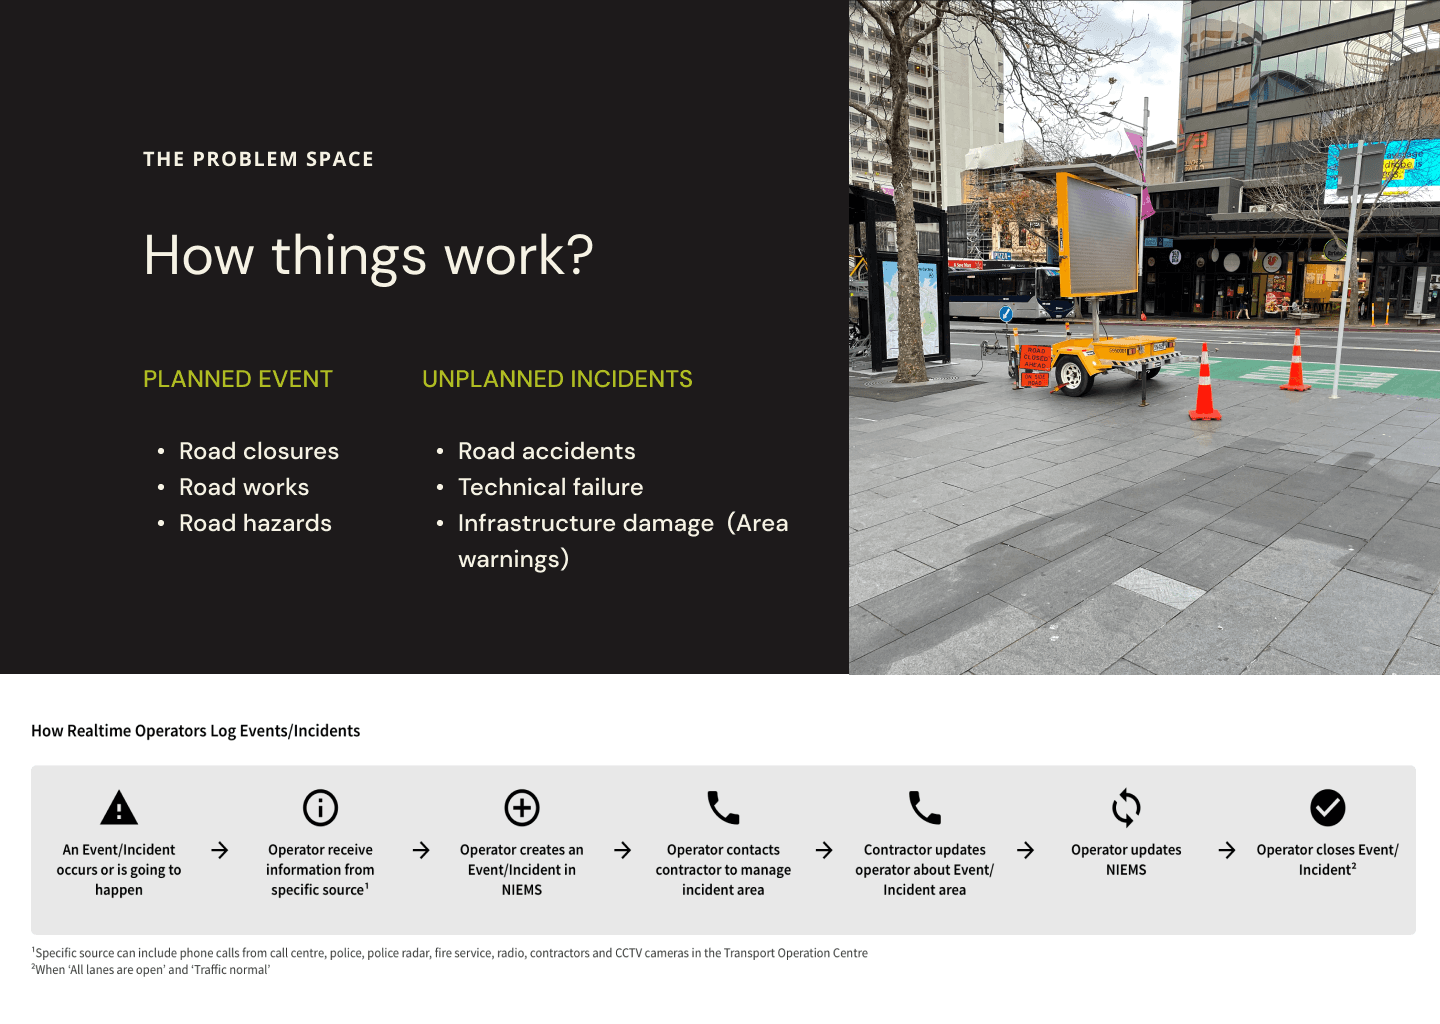
How things work
Define phase
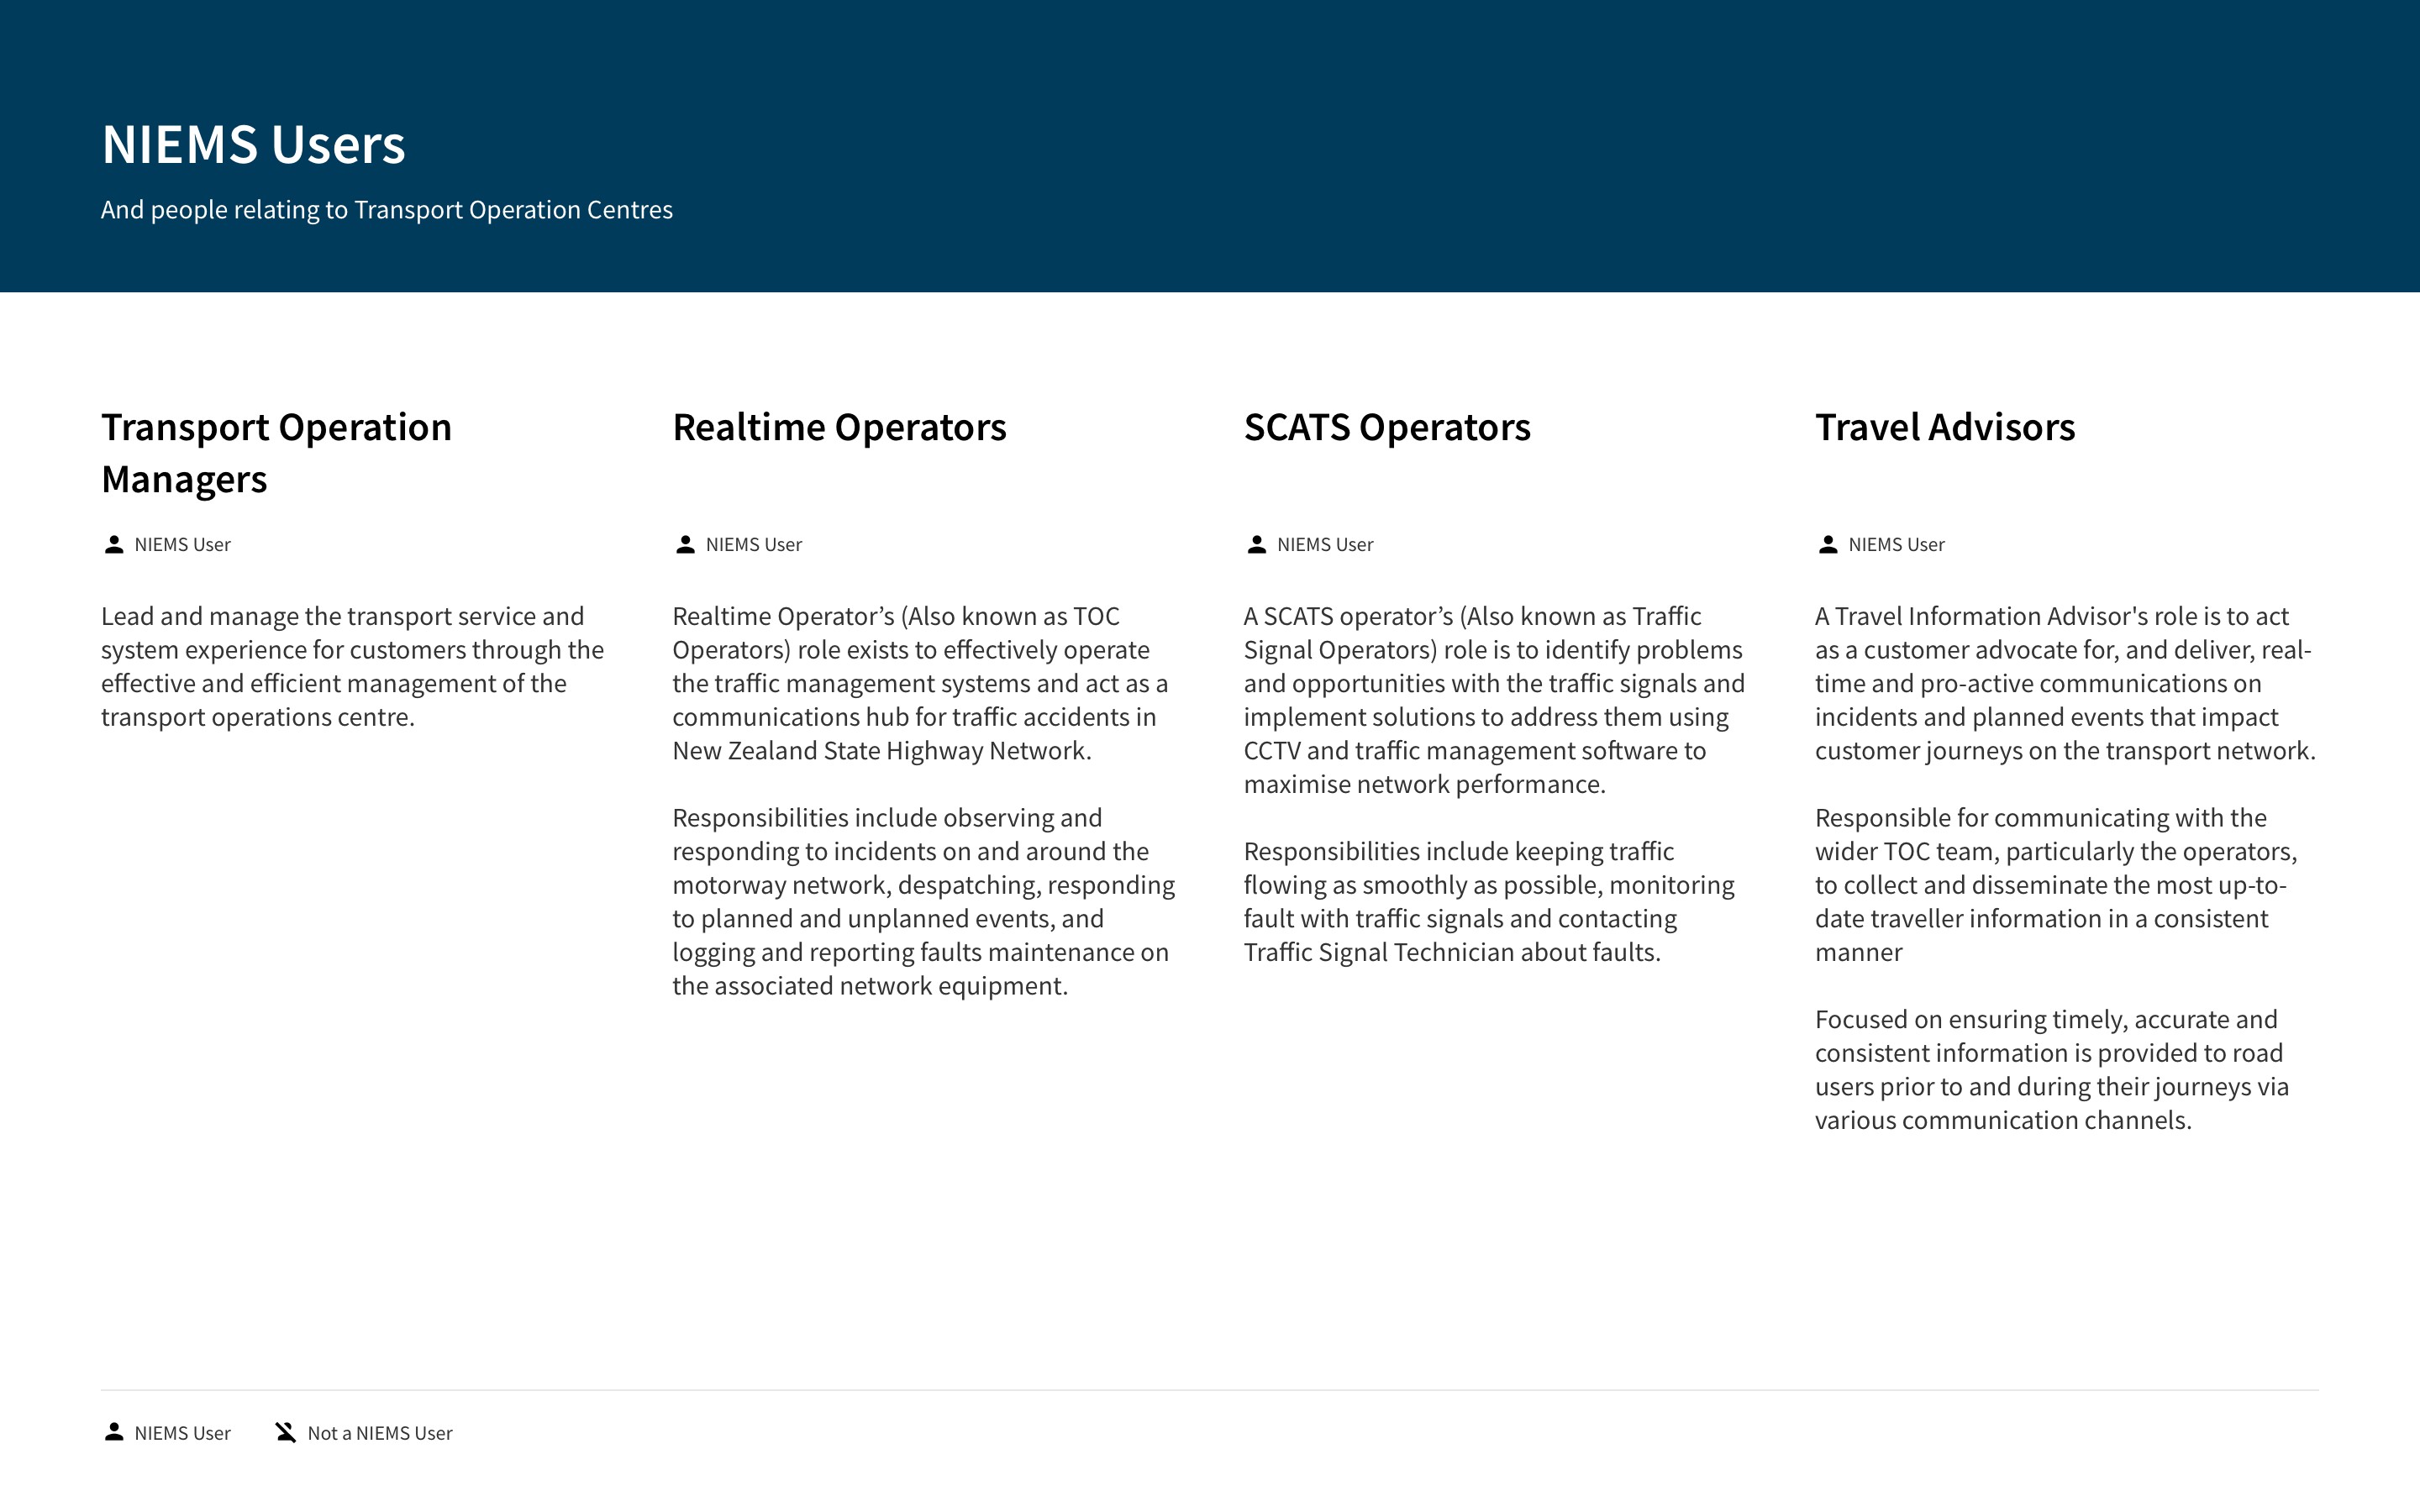
Understanding the user type and persona
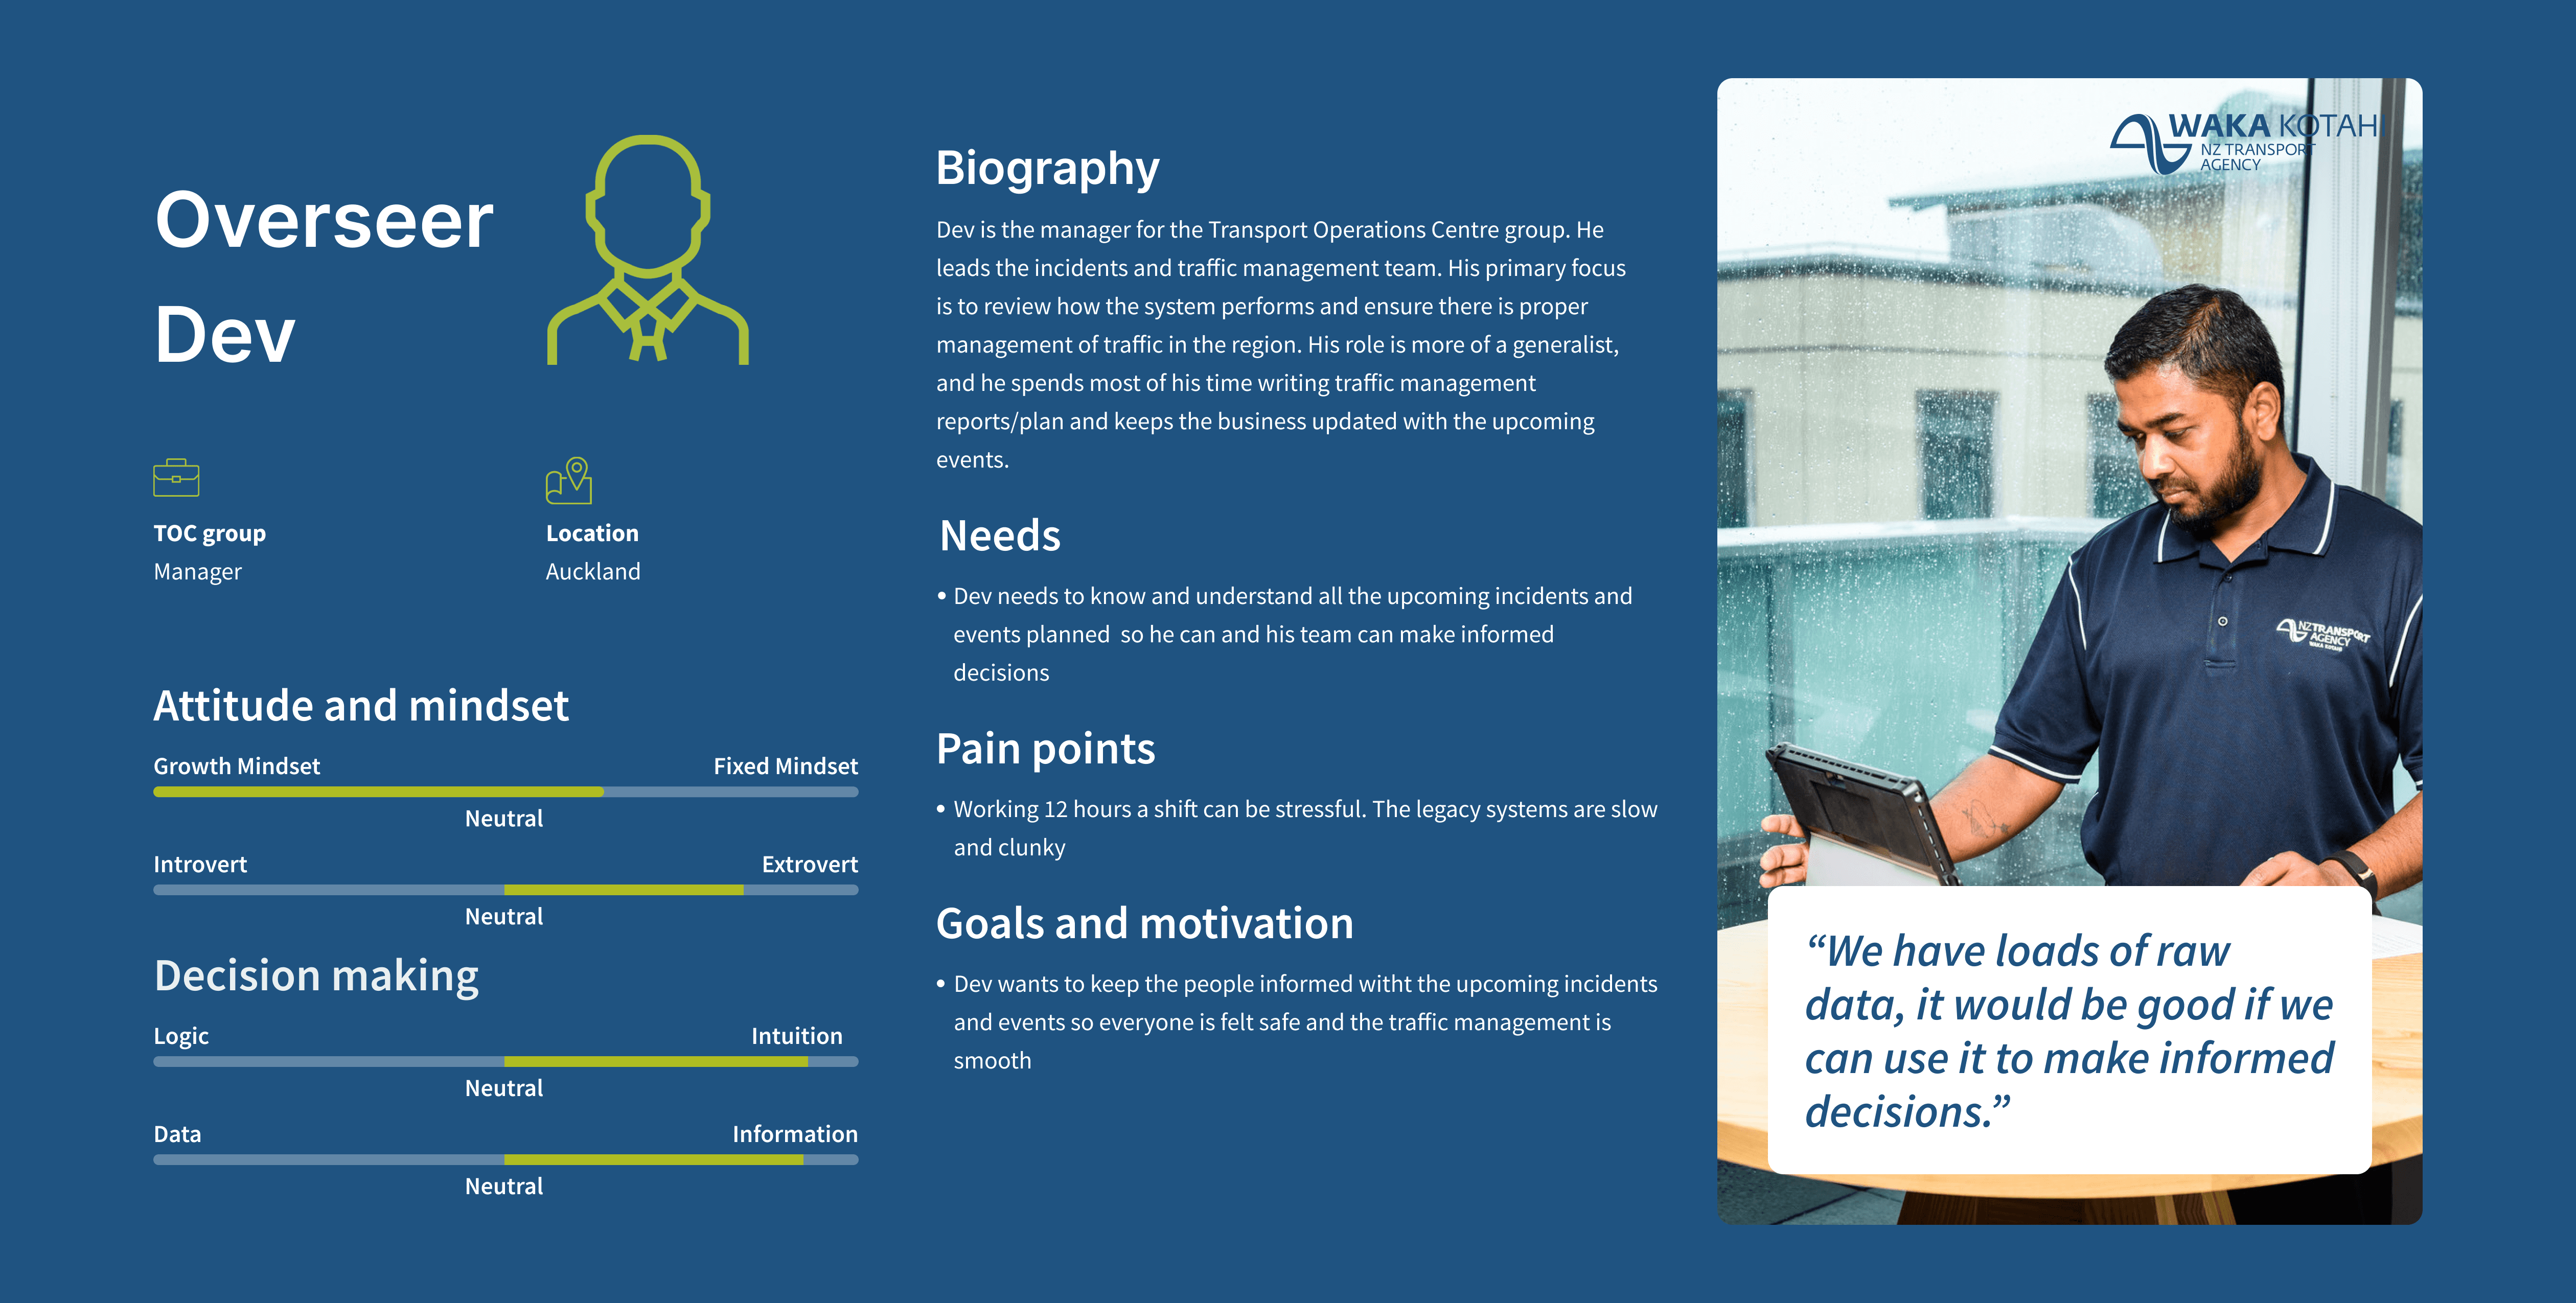
TOC operations manager
User flow diagram

Flow diagram
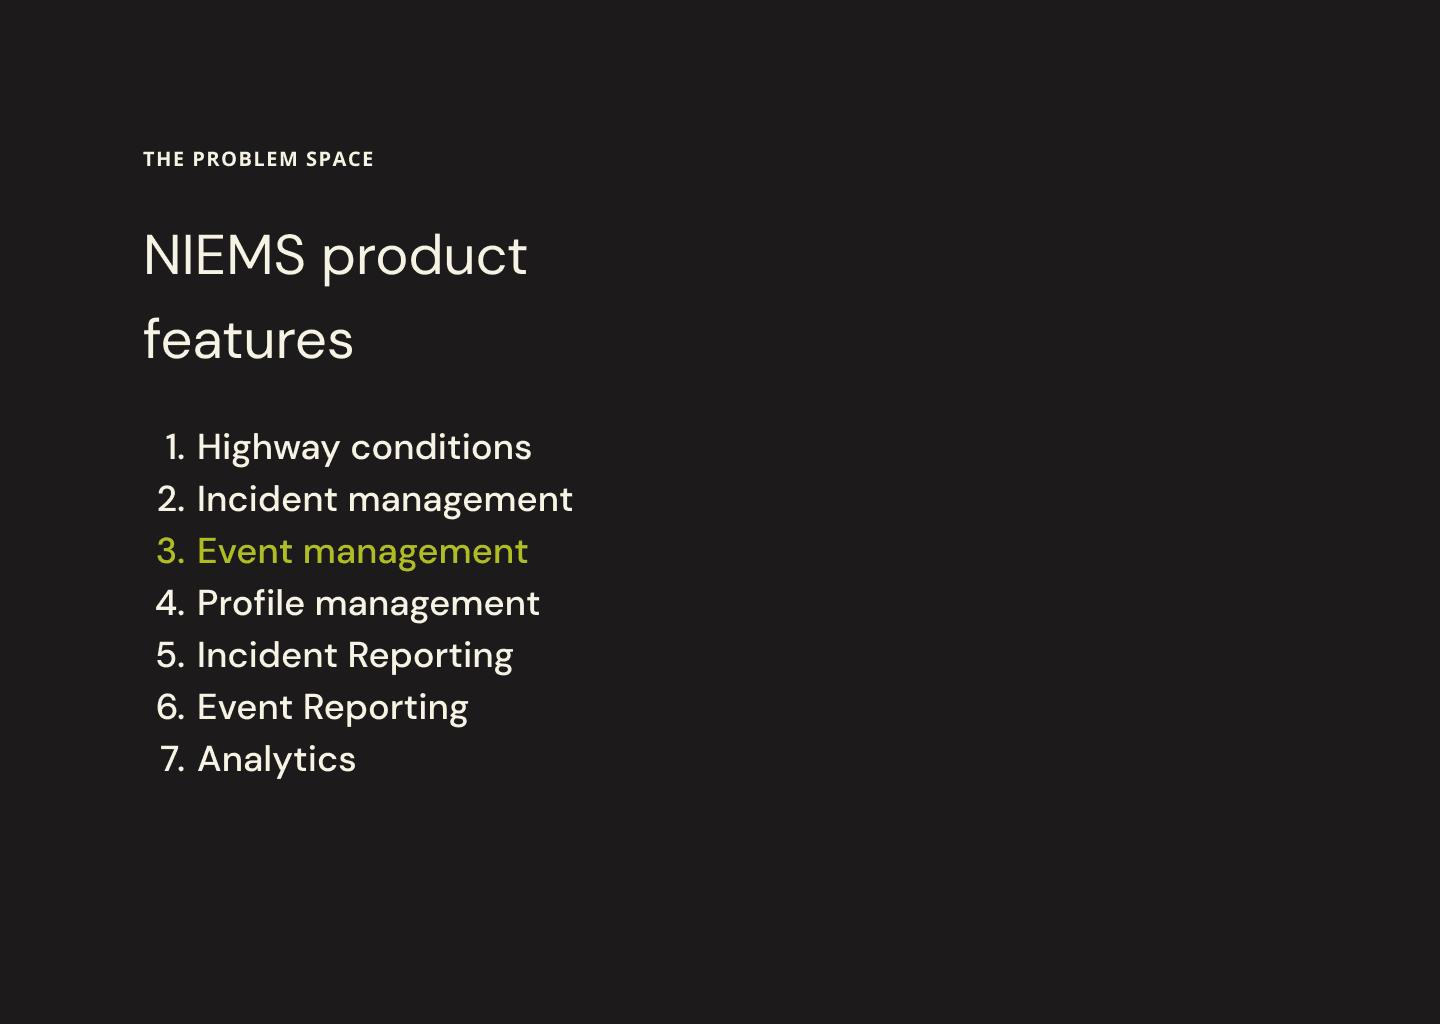
Product features
Design phase
Design, feedback, iterate, repeat
Event management flow
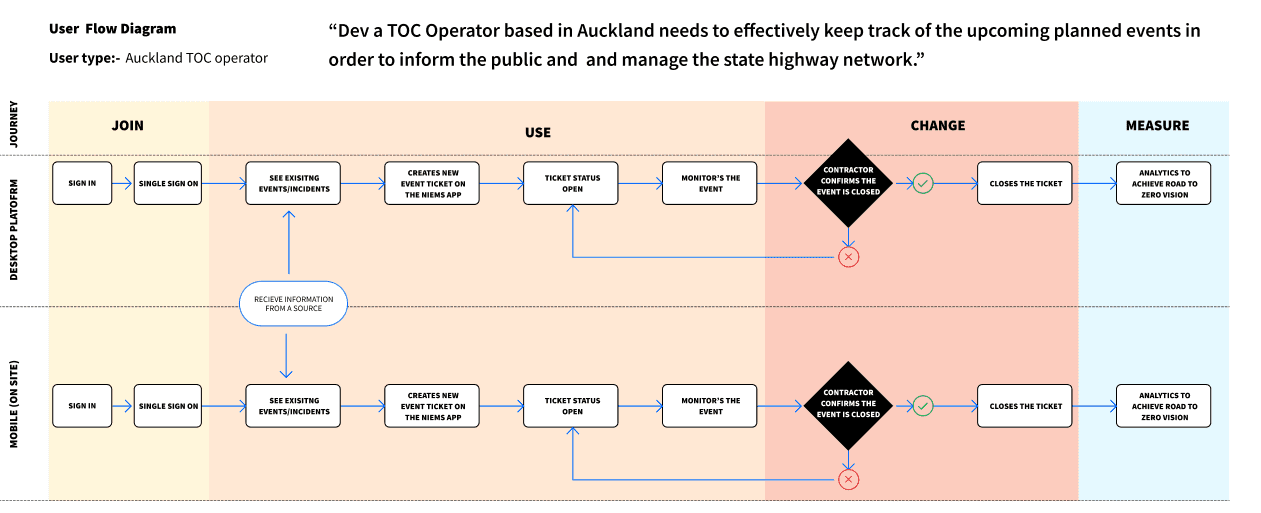
Event management flow
Med-Fi designs
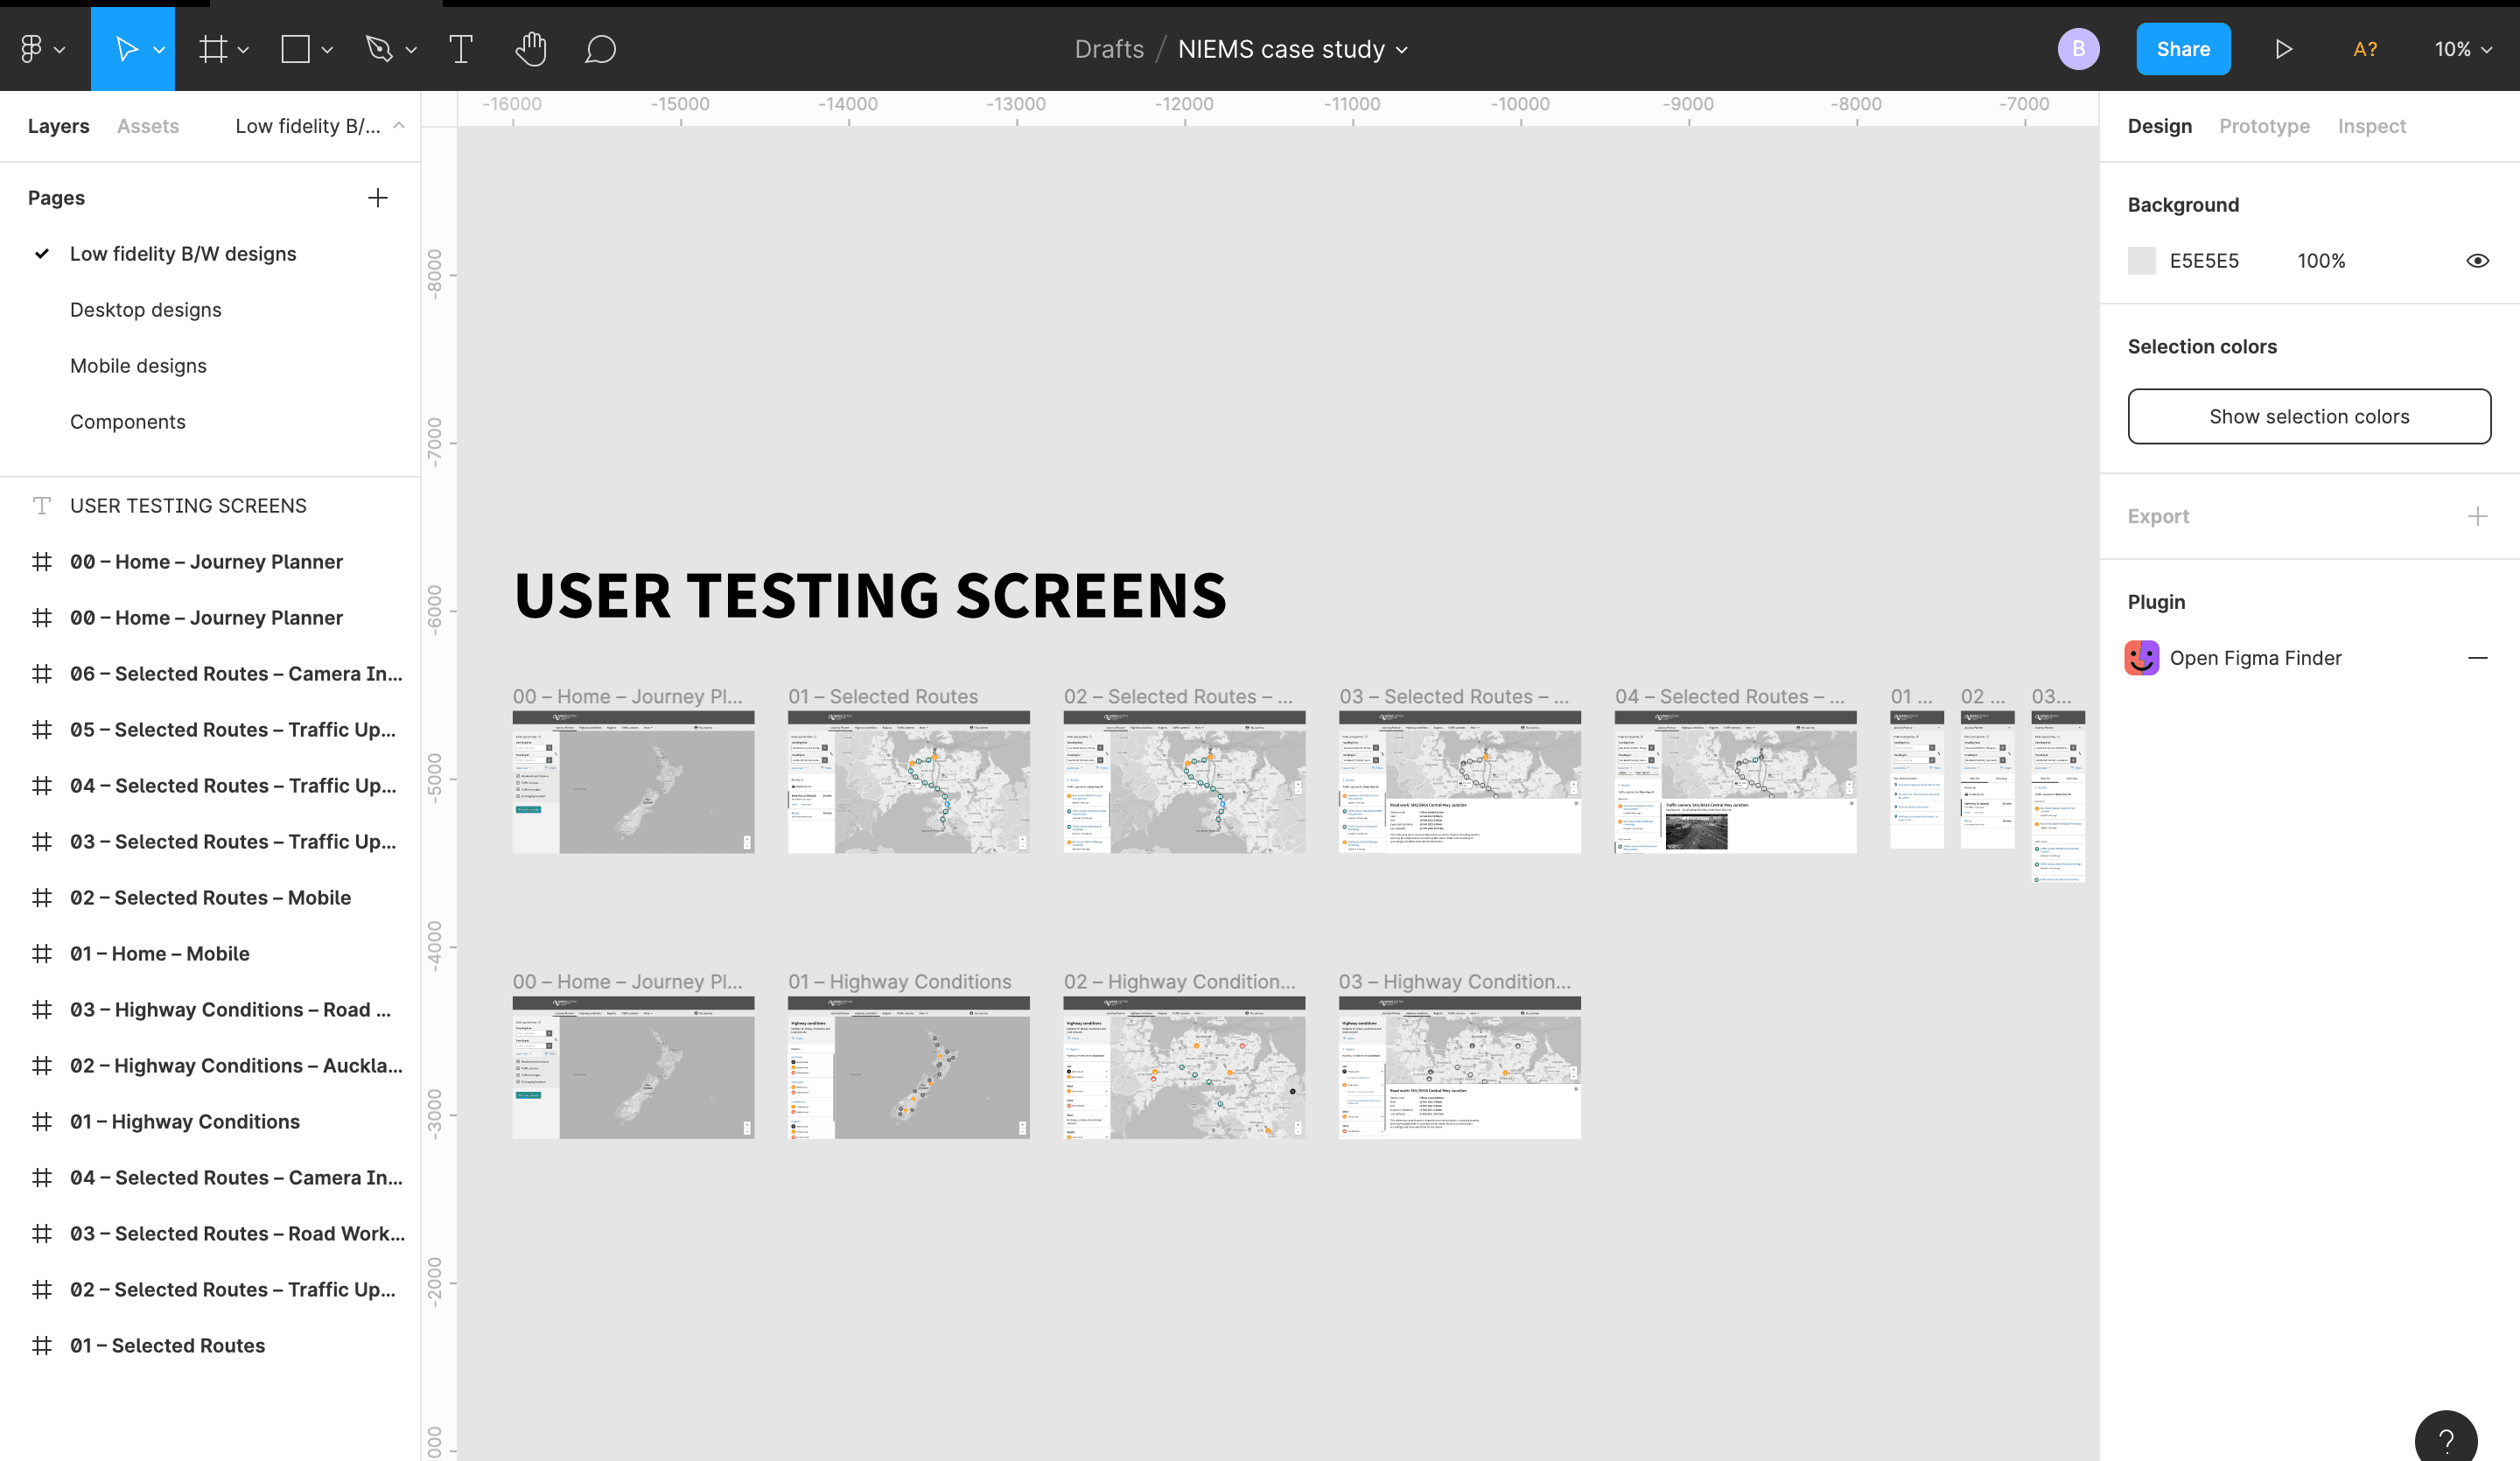
B/W screen designs
NZTA Design System
Working on the NIEMS software helped me set up NZTA's first design system. This was a collaborative effort shared between three designers. The design system was developed by following best practices from Google's material design whilst maintaining NZTA' brand guidelines.
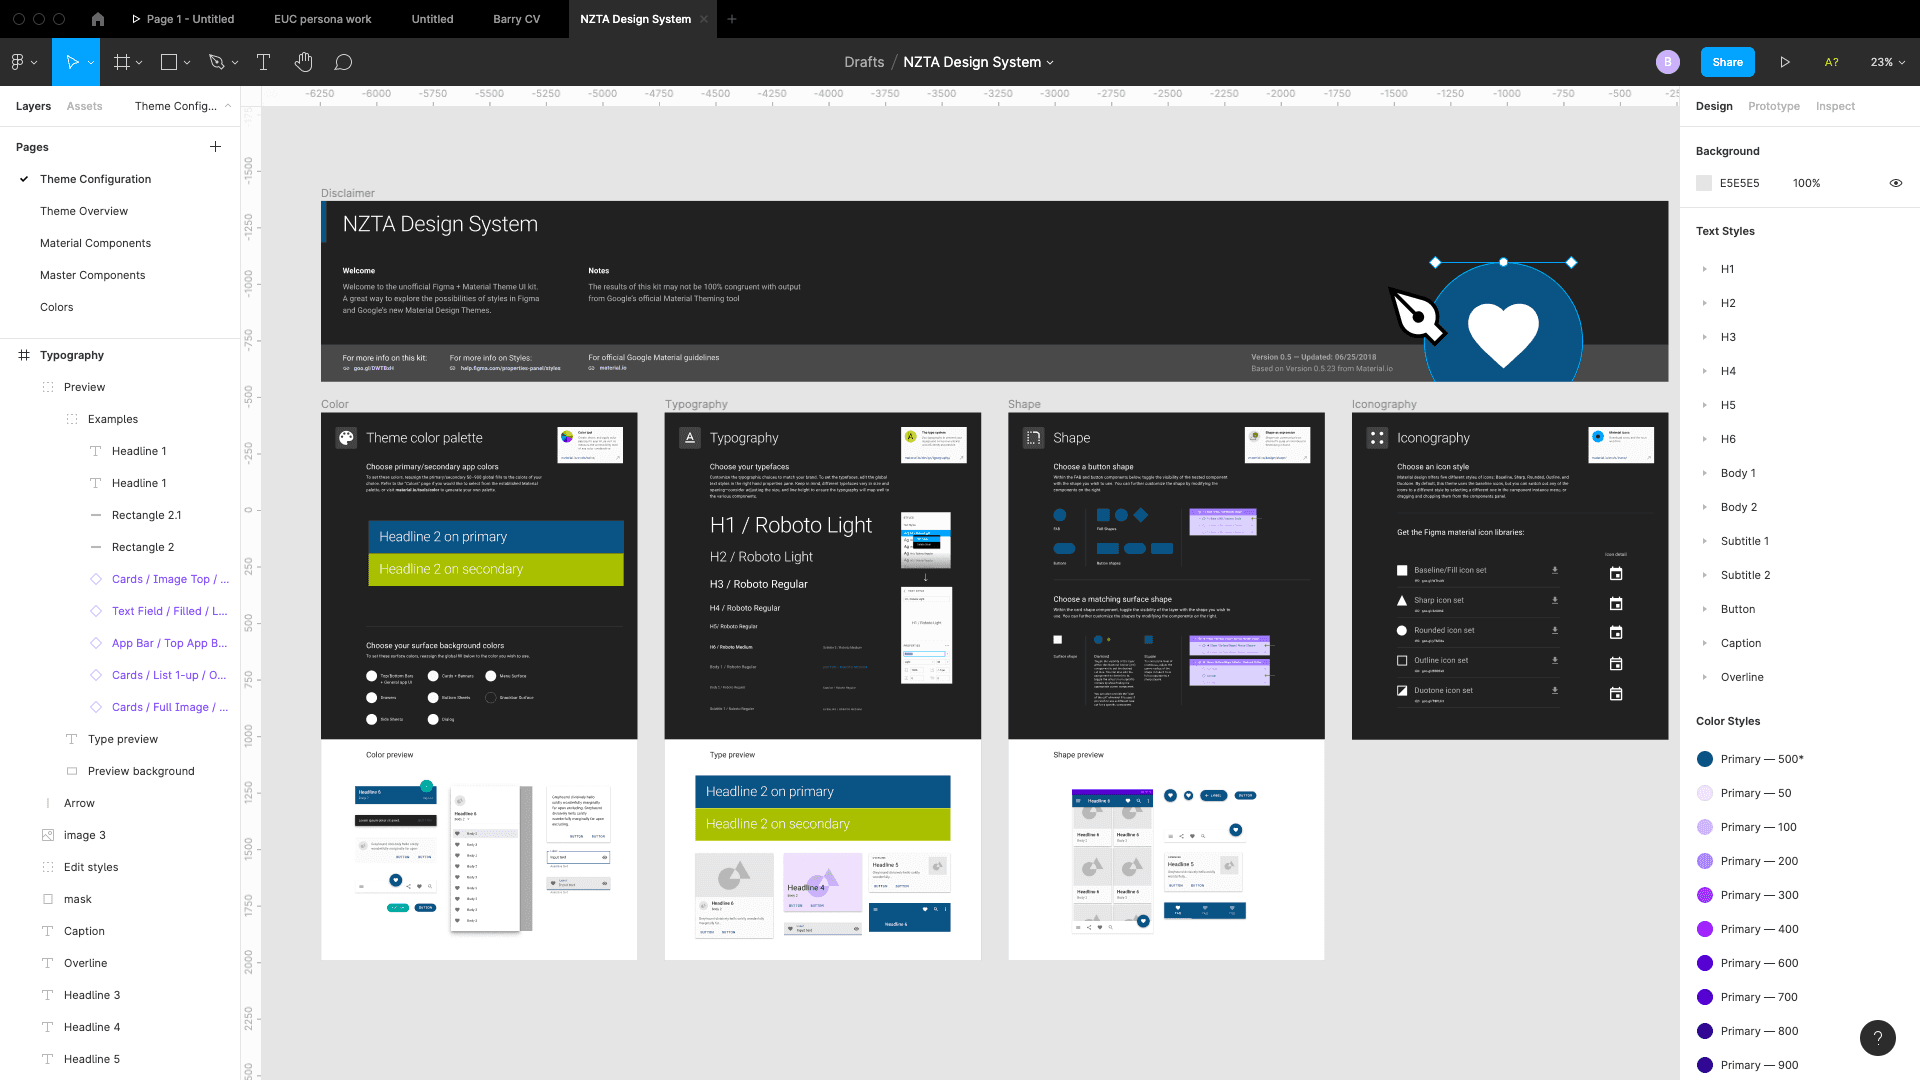
NZTA Design System
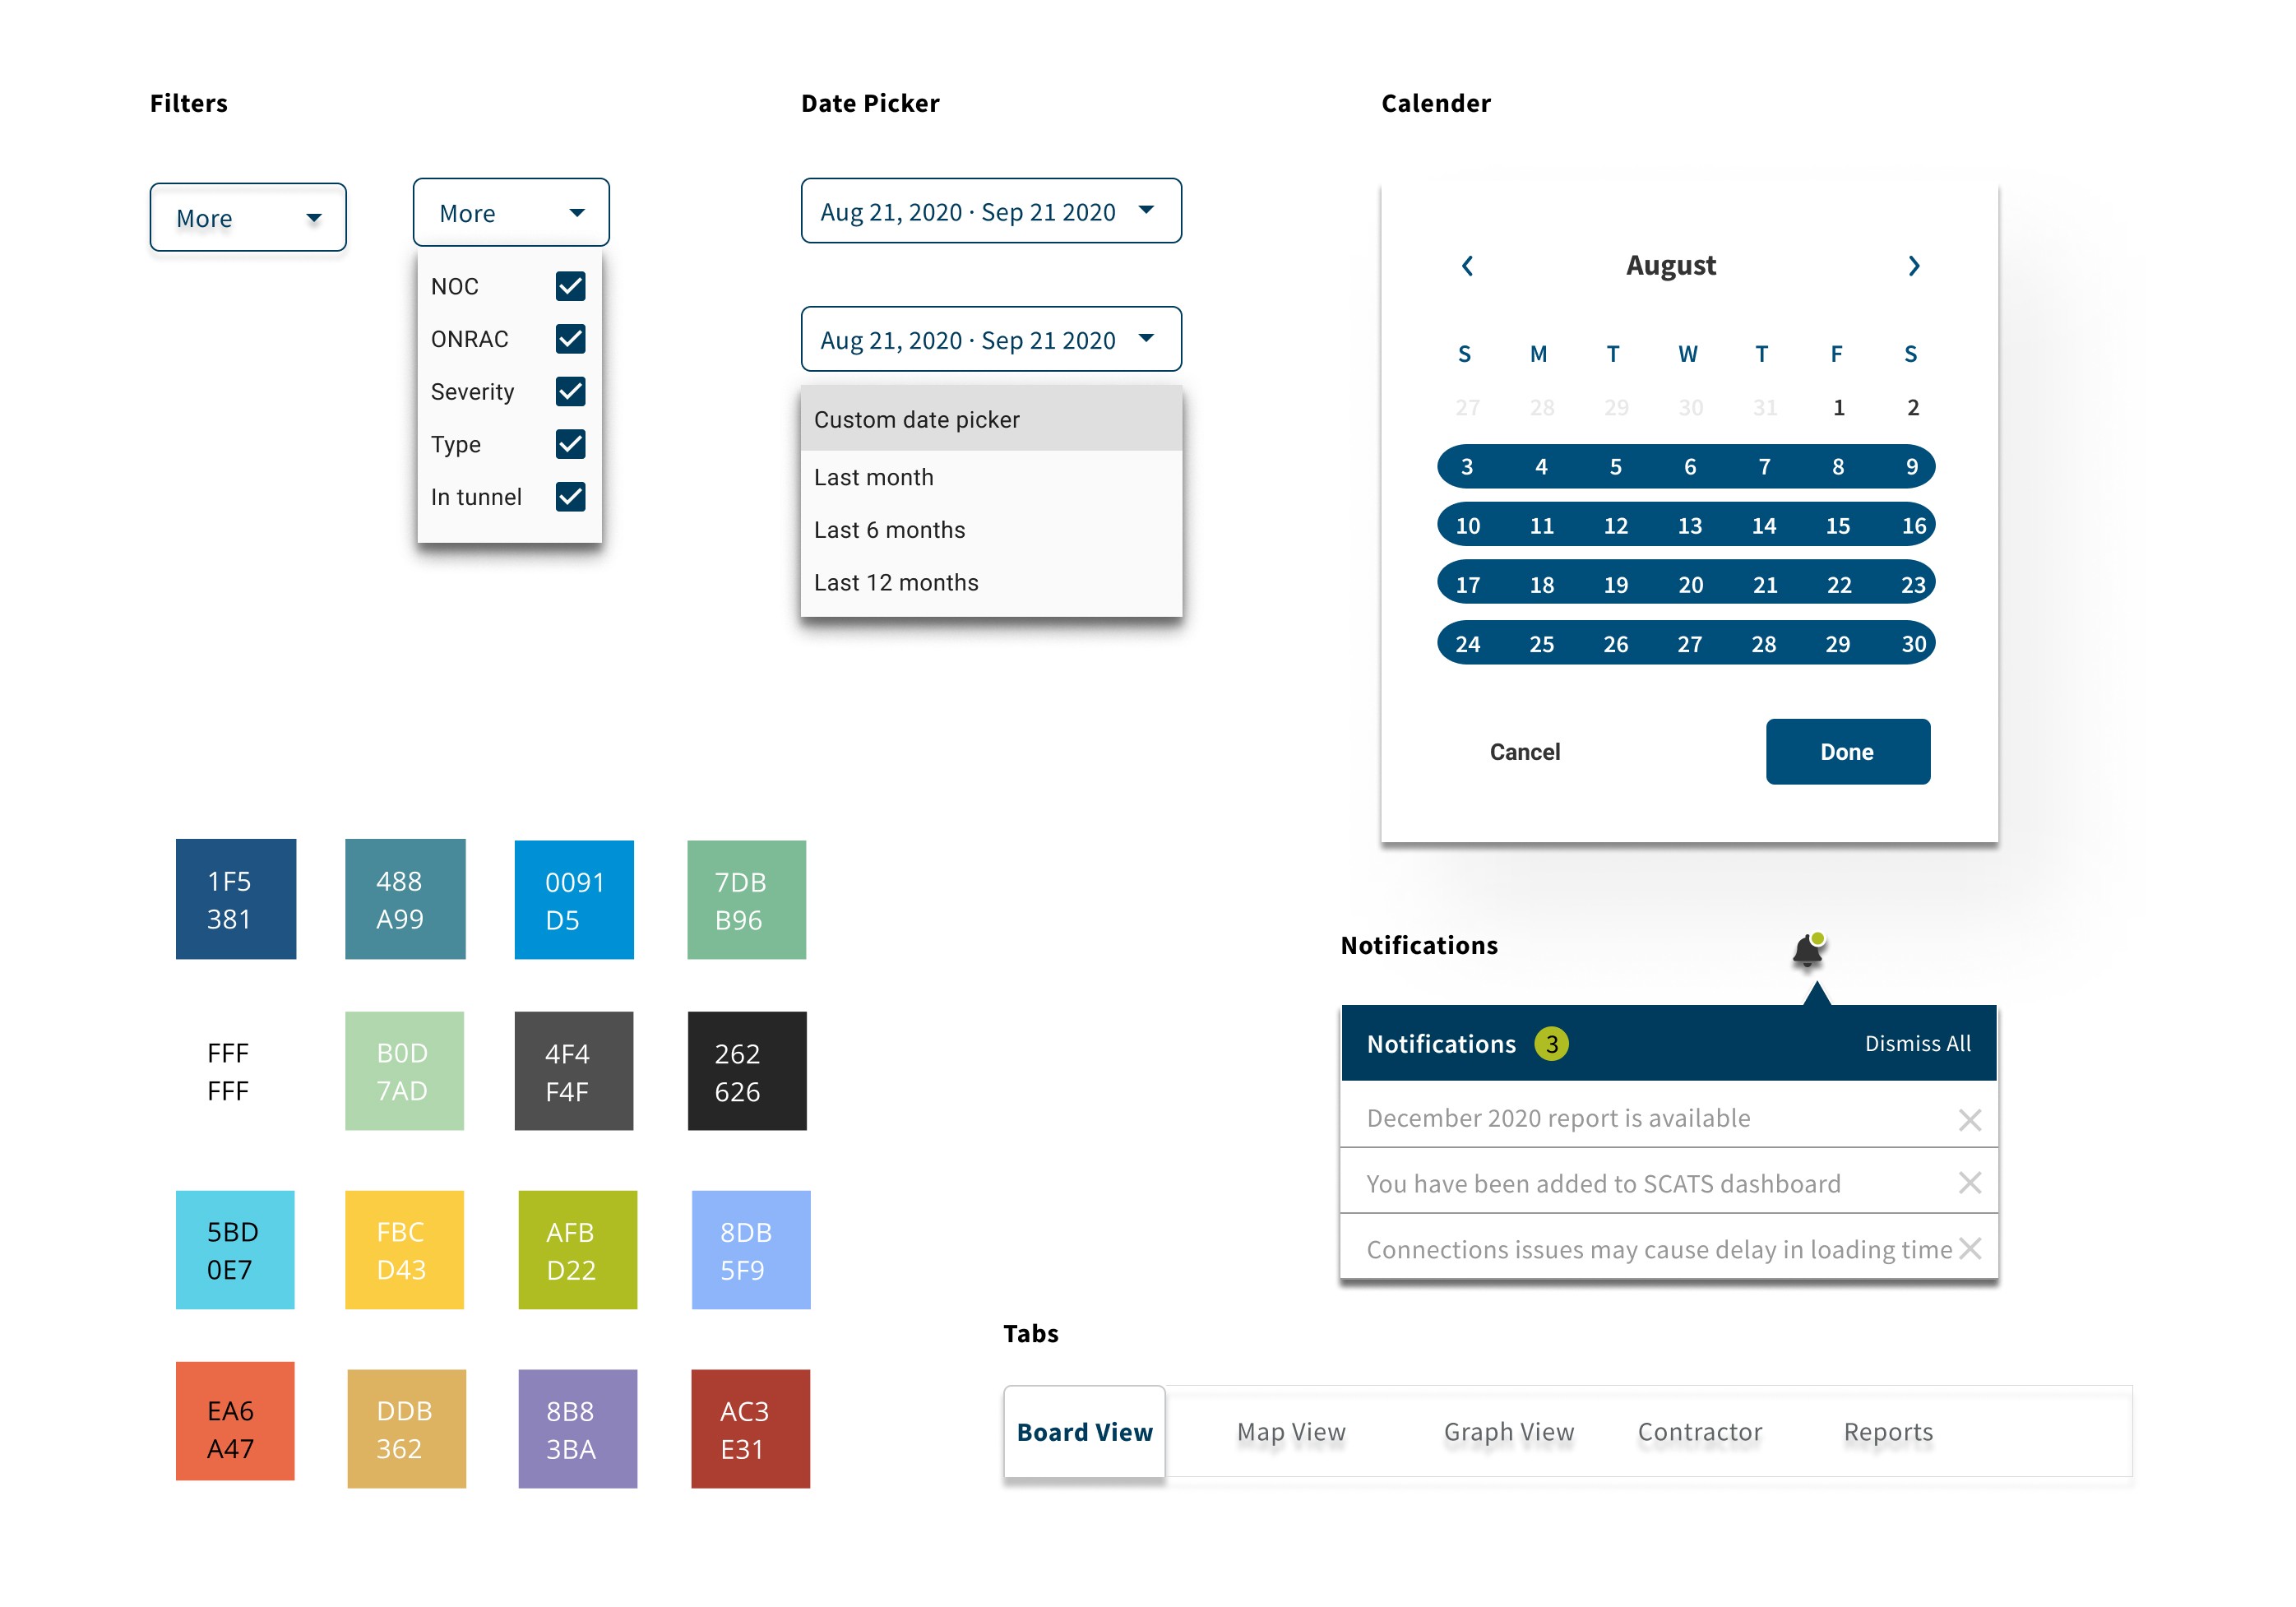
UI Elements
The software and tools used in the project is Figma
User Testing- feedback
Due to the COVID level 3 alert situation remote usability testing was conducted
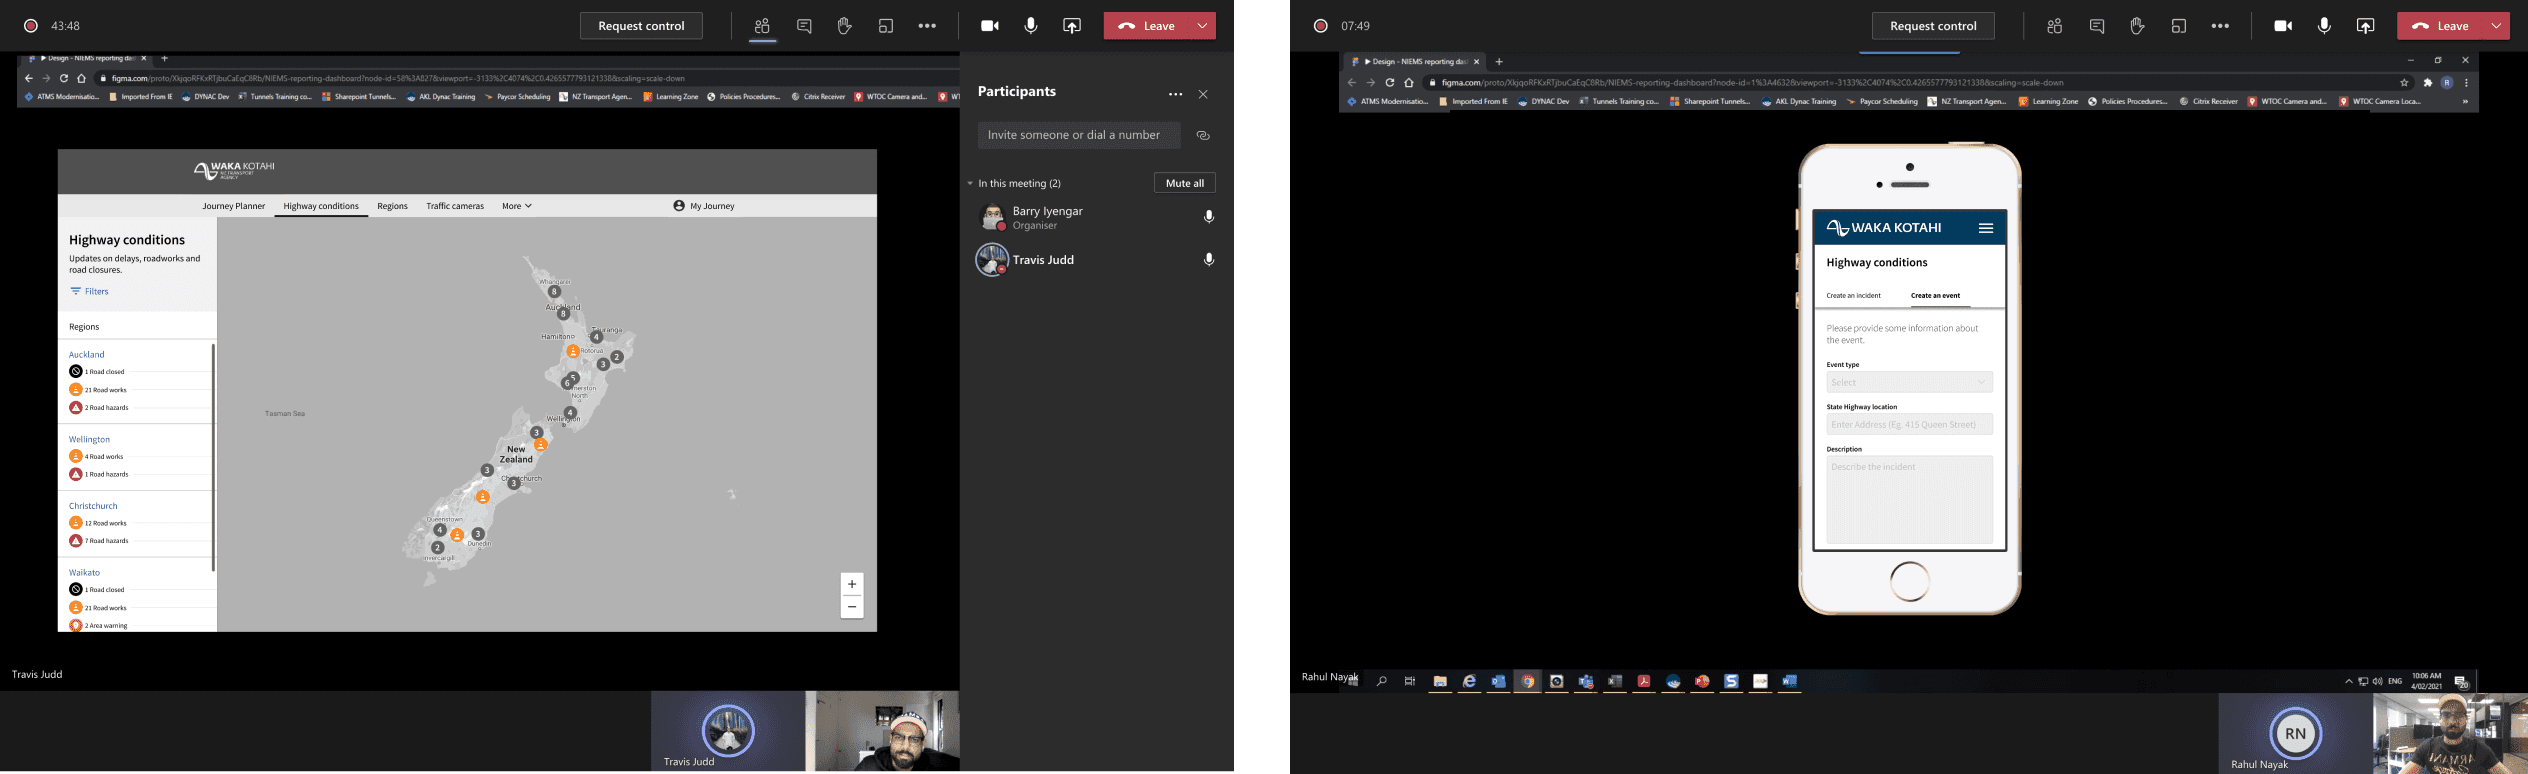
Remote testing session

ACCESSIBILITY
Following best practice WCAG guidelines (meeting AA and AAA contrast requirements
The final desktop prototype can be viewed here
The final mobile prototype can be viewed here
Deliver
Delivery phase
Stakeholders presentation
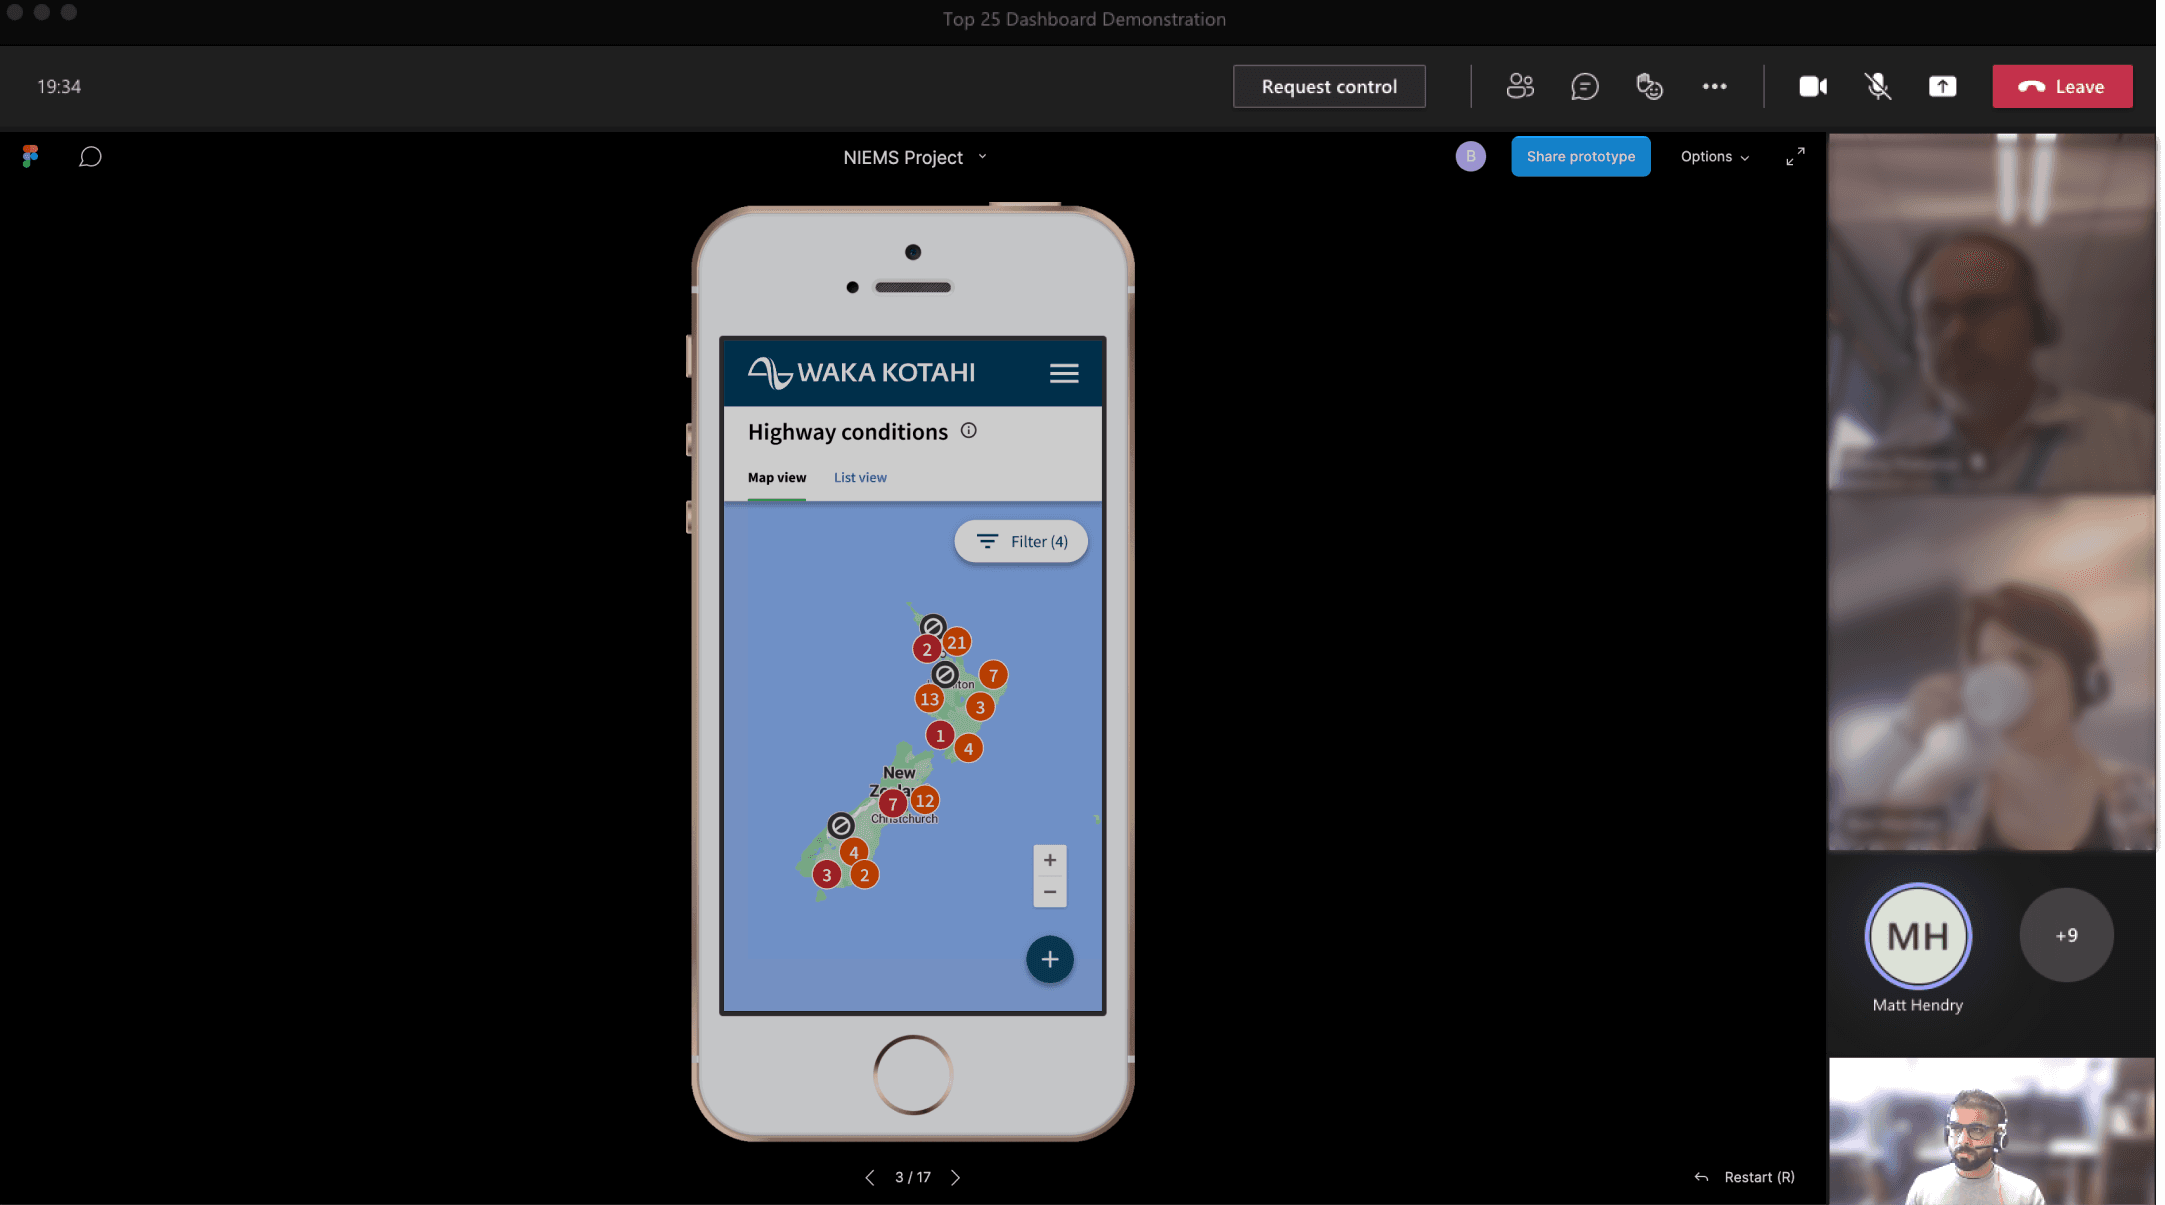
Stakeholder presentation
Hand over to the devs
On design completion the project was handed over to the devs for execution
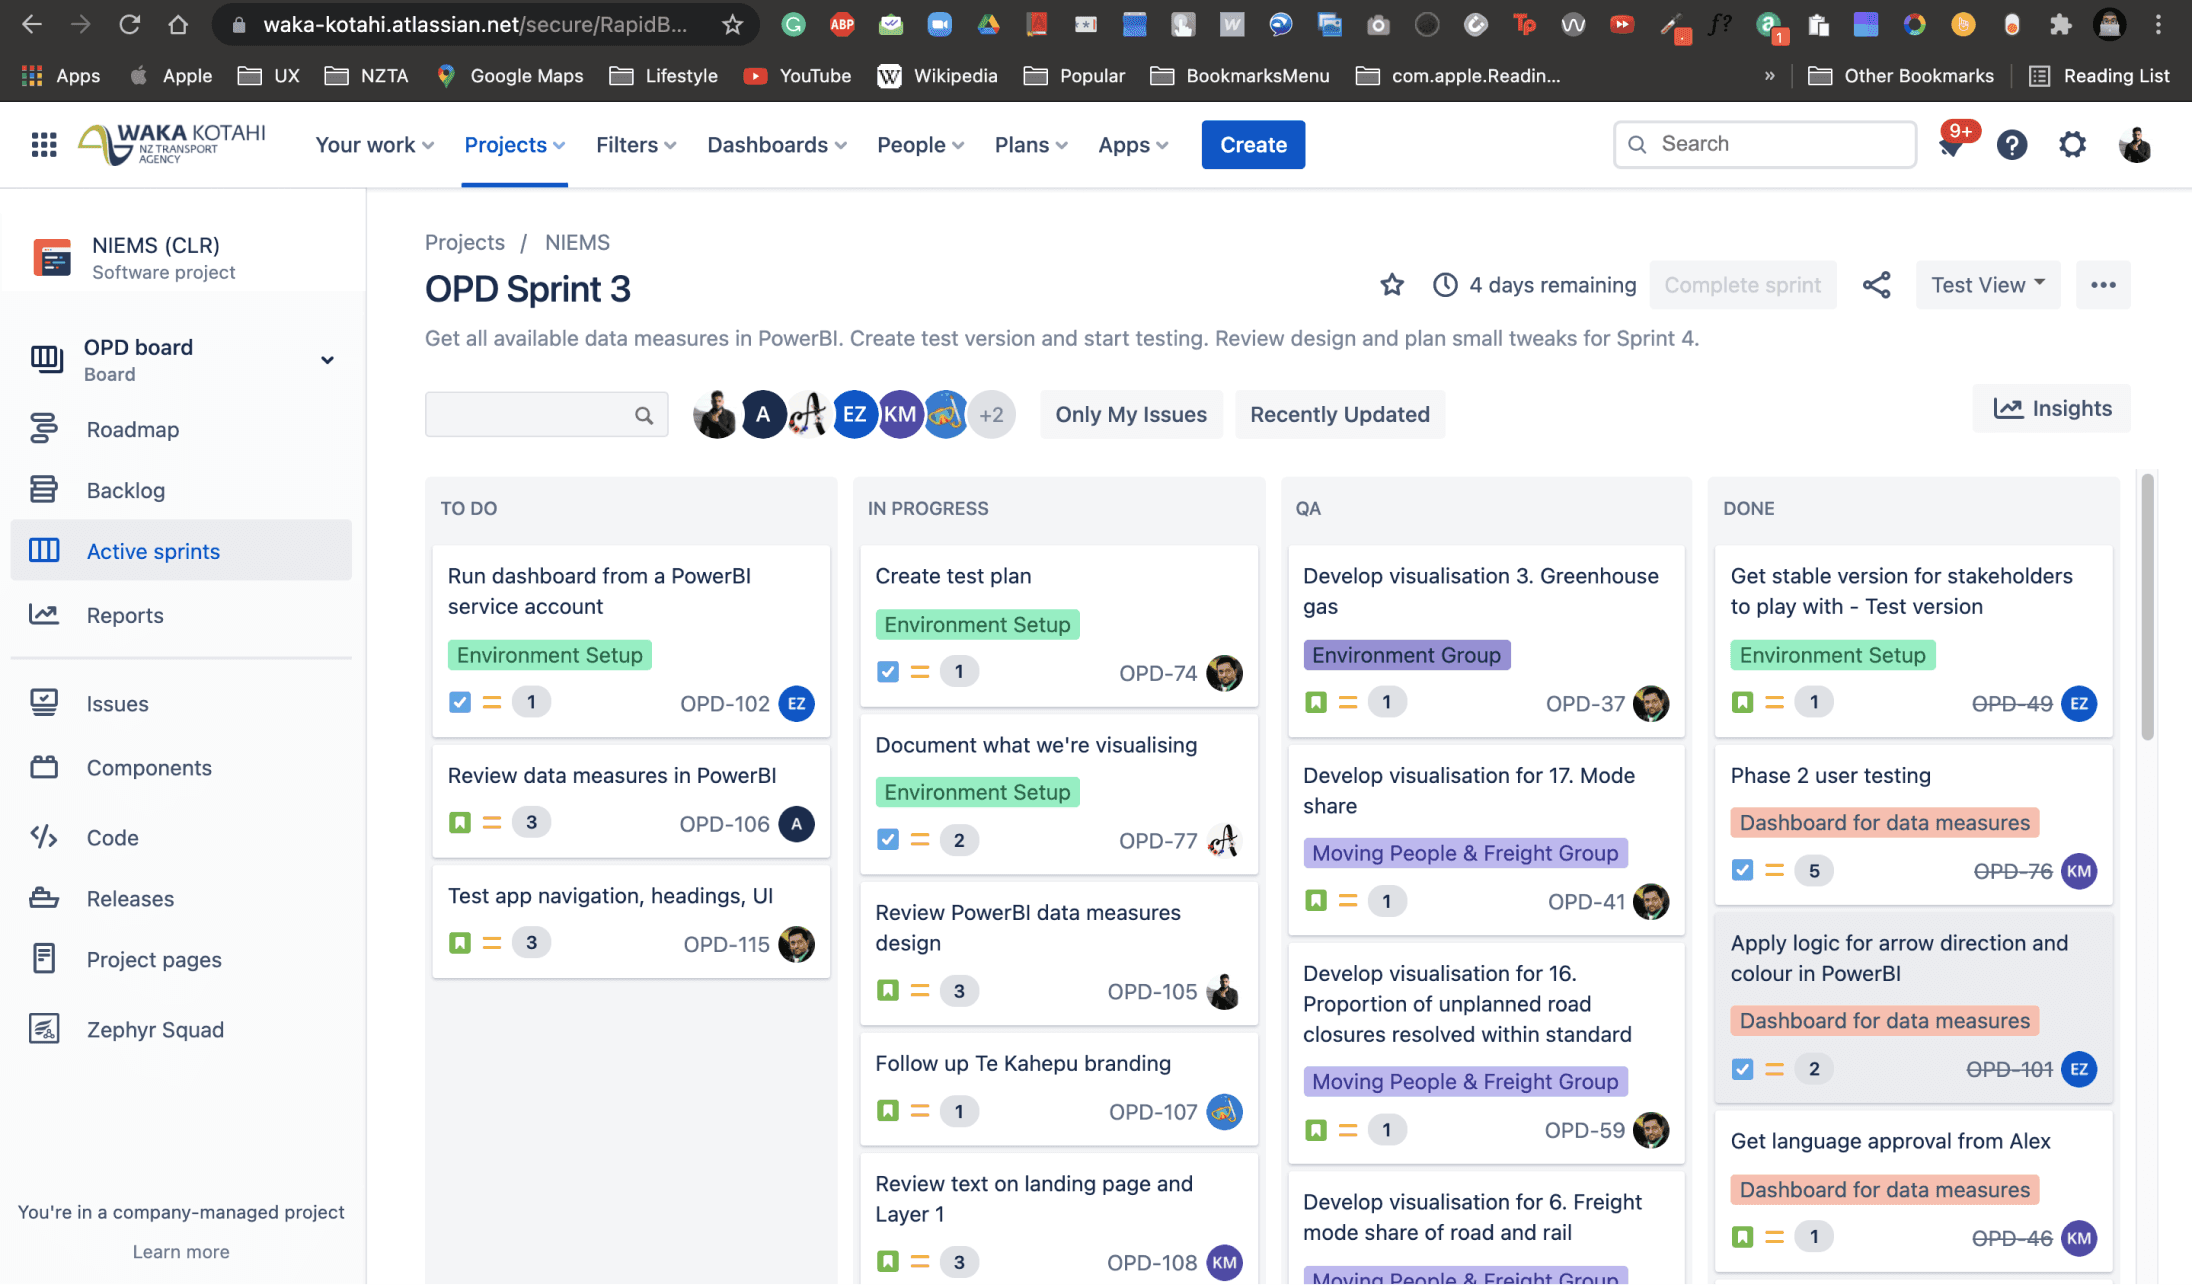
Jira board
Learnings
Conducting remote usability testing and observing the participants was a good learning experience. Recording the tests helped me revisit and work on the iterations on a much more detailed way without missing out on any feedback or comments.
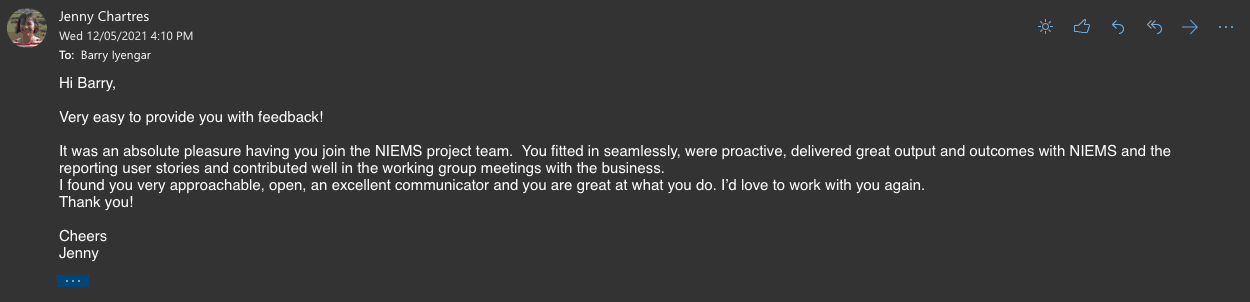
Kind words from the project manager
Thank you for reading!


